
Virology Methods and Protocols

Virology methods help scientists detect viruses, measure viral genomes or infectious particles, study viral replication, examine immune responses, identify genetic changes, and test vaccines or antiviral treatments. The right method depends on the question being asked.
A polymerase chain reaction test may show that viral DNA or RNA is present, but that result does not by itself prove that the sample contains infectious virus. A plaque assay measures infectious units, but only when the virus can infect a suitable host-cell system and produce countable plaques. Serology can reveal an antibody response, yet its meaning depends on the virus, specimen timing, vaccination history, previous exposure, and possible cross-reactivity.
Virology Methods and Protocols Guide:
- What Do Virology Methods Measure?
- Which virology method do I need?
- The Virology Workflow: From Specimen to Result
- Specimen Collection, Transport, and Pre-Analytical Control
- Information Worth Recording for Every Specimen
- Biosafety in Virology Laboratories
- Virus Isolation and Cell Culture
- Cytopathic Effect
- Advantages and Limitations of Virus Culture
- Plaque Assays, Focus-Forming Assays, and TCID50
- Plaque Assay
- Focus-Forming Assay
- TCID50 Assay
- Hemagglutination and Hemadsorption Assays
- Viral Antigen Detection
- Serology and Viral Antibody Testing
- Important Serology Limitations
- Neutralization Assays
- PCR and RT-PCR in Virology
- Qualitative and Quantitative Molecular Testing
- RT-qPCR, Cq Values, and Viral Load
- Digital PCR
- Viral Genome Sequencing
- Major Sequencing Approaches
- Sequencing Quality Information to Report
- Microscopy and Tissue-Based Virology Methods
- Light Microscopy and Histology
- Immunofluorescence and Immunohistochemistry
- In Situ Hybridization
- Electron Microscopy
- Flow Cytometry, Reporter Assays, and Advanced Cell Models
- Antiviral Susceptibility and Inhibition Assays
- Viral Load, Virus Titer, and Particle Count Are Different
- Controls Used in Virology Experiments
- Molecular Assay Controls
- Cell-Based Assay Controls
- Sequencing Controls
- Validating a Virology Method
- Virology Troubleshooting Guide
- How to Write a Reproducible Virology Protocol
- Reporting Virology Results Clearly
- Choosing the Right Virology Method
- Related BioExplorer Methods and Resources
- Authoritative Virology Standards and References
- Image Credits
- Frequently Asked Questions
No single virology test provides every answer. Reliable work often combines complementary methods such as nucleic acid amplification, antigen detection, virus isolation, infectivity assays, serology, microscopy, and viral genome sequencing.
This guide explains how the major virology laboratory techniques work, what each method measures, which controls matter, how results should be interpreted, and where common failures occur. It supports students, researchers, educators, clinical laboratory professionals, and anyone comparing viral detection and quantification methods.
This page explains method selection and experimental principles. It does not replace an institution-approved standard operating procedure, agent-specific risk assessment, trained supervision, or applicable public health and laboratory regulations.
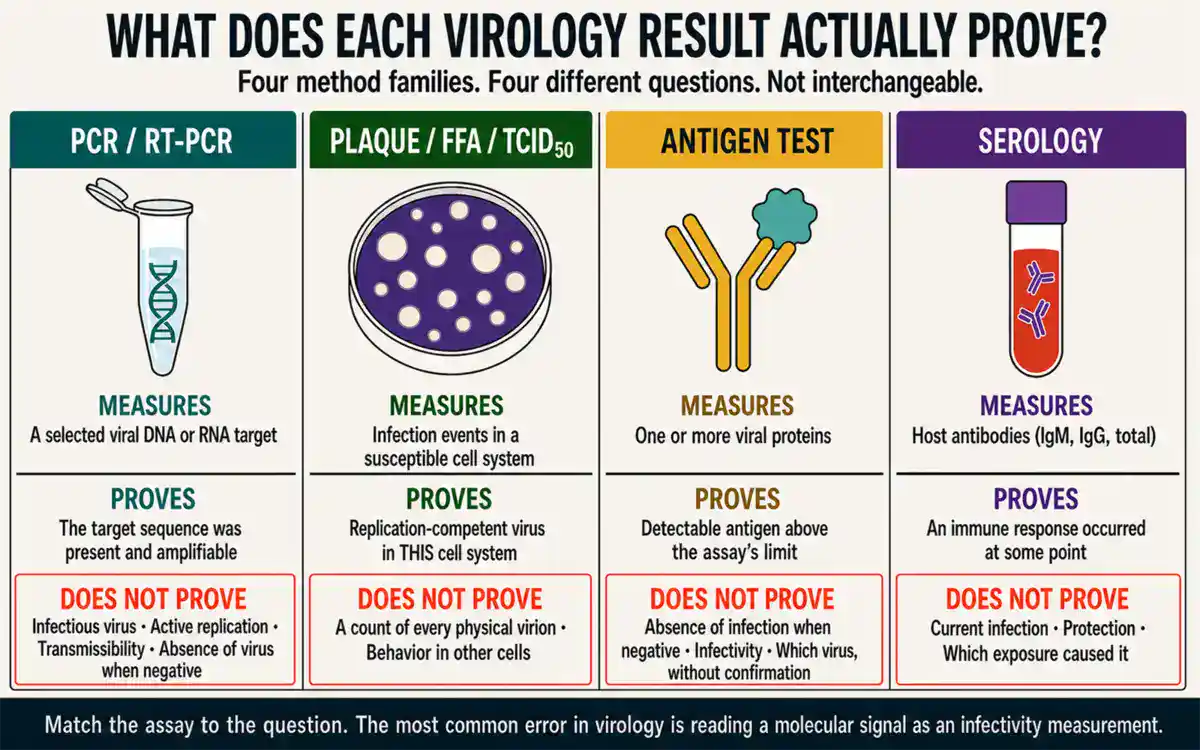
What Do Virology Methods Measure?
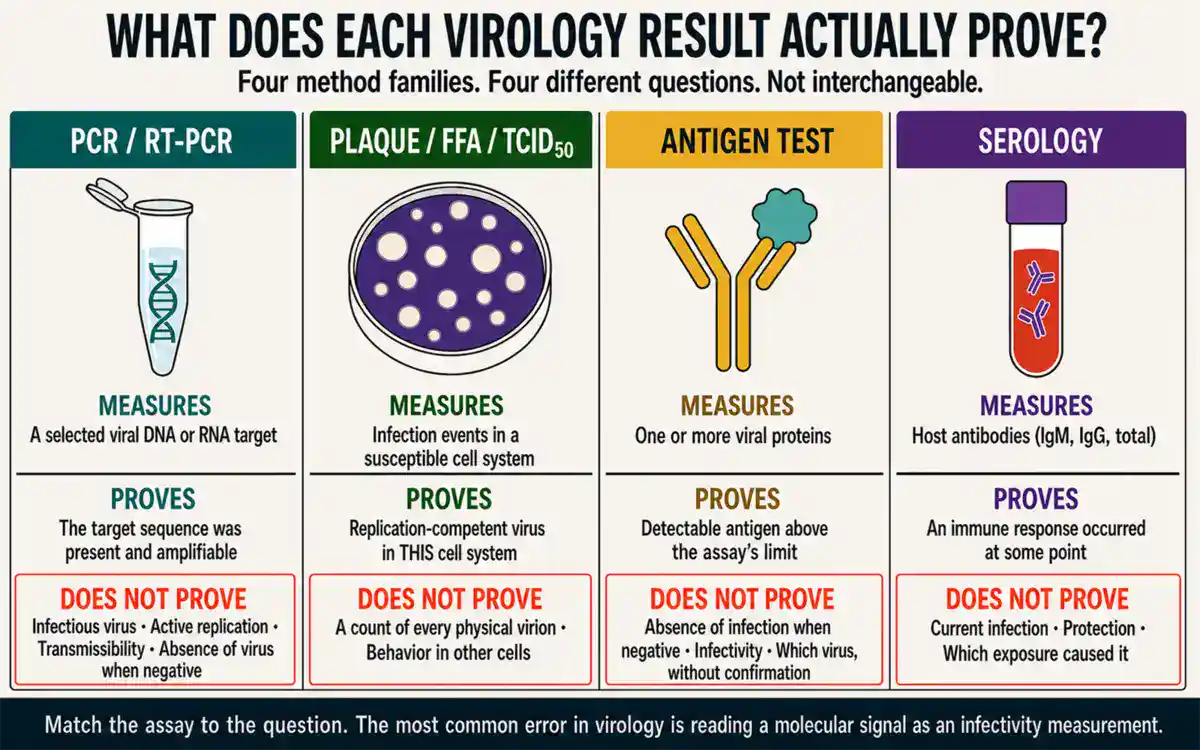
Before choosing a protocol, define the biological measurement you actually need. Detecting a viral genome, counting viral particles, and measuring infectious virus are not equivalent tasks.
| Research or diagnostic question | Commonly used method | What the result represents |
|---|---|---|
| Is genetic material from a known virus present? | PCR, RT-PCR, qPCR, RT-qPCR, or another nucleic acid amplification test | Detection of a selected viral DNA or RNA target |
| How much viral nucleic acid is present? | Quantitative PCR, RT-qPCR, or digital PCR | A calibrated target quantity, genome-equivalent measurement, or target concentration |
| Does the sample contain replication-competent virus? | Virus isolation, plaque assay, focus-forming assay, or endpoint dilution assay | Evidence of infectious virus in the selected host system |
| How many infectious units are present? | Plaque assay, focus-forming assay, or TCID₅₀ assay | PFU, FFU, or a 50% infectious dose estimate |
| Is a viral protein present? | Antigen ELISA, lateral-flow assay, immunofluorescence, immunohistochemistry, or immunoblotting | Antibody-based detection of one or more viral antigens |
| Has the host produced antibodies? | IgM or IgG immunoassay, paired-serum testing, or total-antibody assay | Evidence of a virus-specific or cross-reactive immune response |
| Can the antibodies block infection? | Plaque-reduction neutralization, microneutralization, or pseudovirus neutralization assay | Functional neutralizing activity under the assay conditions |
| Which virus, genotype, lineage, or genetic changes are present? | Sanger sequencing, amplicon sequencing, whole-genome sequencing, or metagenomic sequencing | Viral sequence information and its bioinformatic interpretation |
| Where is the virus or viral antigen located in cells or tissues? | Microscopy, immunofluorescence, immunohistochemistry, or in situ hybridization | Spatial evidence of viral structures, proteins, or nucleic acids |
Matching the assay to the question prevents one of the most common mistakes in virology: treating a molecular signal as though it were an infectivity measurement.
Which virology method do I need?
Answer up to three questions to narrow the list. Every method below shows what it measures, which controls it needs, and, critically, what its result does not prove.
PCR and RT-PCR
Molecular- Measures
- One selected viral DNA or RNA target. RNA viruses need a reverse-transcription step first, which is what the “RT” denotes.
- Reported as
- Detected or Not detected
- Key controls
- No-template control · extraction blank · positive amplification control · internal inhibition control
Does not prove: infectious virus, active replication, transmissibility, or disease causation. A negative result does not prove the virus was absent either. Check inhibition, target degradation, primer or probe mismatch, and whether the right site was sampled.
Read the full section →qPCR and RT-qPCR
Molecular- Measures
- A calibrated quantity of the nucleic acid target, read from a real-time amplification curve.
- Reported as
- Copies/mL, international units/mL, or another calibrated unit, alongside the Cq value and the assay identity
- Key controls
- Standard curve or calibrator · amplification efficiency check · no-template control · extraction blank · inhibition control
Does not prove: anything about infectivity. A raw Cq is also not a portable viral-load unit. It shifts with extraction method, elution volume, reaction chemistry, instrument, threshold setting, and efficiency, so do not compare Cq values across assays or laboratories. Report per MIQE 2.0 (Clin Chem 2025).
Read the full section →Digital PCR (dPCR)
Molecular- Measures
- Target concentration by partitioning the sample into thousands of small reactions, then applying Poisson statistics to the proportion of negative partitions.
- Reported as
- Copies per unit volume, without an external standard curve
- Key controls
- Accepted-partition count · threshold placement · no-template control · reverse-transcription efficiency check
Does not prove: infectivity. It is also not assumption-free just because it skips the standard curve. Partition volume, accepted-partition count, molecular integrity, inhibition, and the statistical model all shape the estimate. Report per dMIQE2020 (Clin Chem 2020).
Read the full section →Virus isolation and cell culture
Infectivity- Measures
- Whether the specimen can produce growing virus in a susceptible host system: cultured cells, embryonated eggs, organoids, indicator plants, or an approved animal model.
- Reported as
- Isolate recovered or not recovered, normally with confirmatory identification
- Key controls
- Uninfected cell control · known positive culture control · monolayer health check · sterility check
Does not prove: absence of infection when negative. Some viruses grow poorly, need specialised host cells, or produce no visible cytopathic effect. Cytopathic effect alone is not identification, because toxic specimens, contamination, and unrelated viruses cause similar changes. Confirm by immunostaining, PCR, or sequencing.
Read the full section →Plaque assay
Infectivity- Measures
- Discrete localised infectious events in a susceptible cell monolayer held under a semi-solid overlay that restricts spread.
- Reported as
- PFU/mL, or PFU/g for tissue homogenates
- Key controls
- Uninfected monolayer · reference virus stock · diluent-only control · consistent staining and plaque-scoring criteria
Does not prove: the physical number of virions. A plaque-forming unit is an operational measurement, and particle aggregation, incomplete particles, damaged virions, and host-cell susceptibility all change the count. PFU, FFU, and TCID₅₀ are related but not interchangeable units.
Read the full section →Focus-forming assay (FFA)
Infectivity- Measures
- Clusters of infected cells detected with virus-specific antibodies or a reporter, so visible cell destruction is not required.
- Reported as
- FFU/mL
- Key controls
- Antibody specificity control · uninfected monolayer · reference virus stock · consistent focus-scoring rule
Does not prove: equivalence to a plaque titer. Choose a focus-forming assay when the virus makes weak plaques or you need an earlier endpoint, but do not convert between FFU and PFU using a factor borrowed from another virus, cell line, or laboratory.
Read the full section →TCID₅₀ endpoint dilution assay
Infectivity- Measures
- The dilution at which 50% of replicate cultures meet a defined infection endpoint, estimated statistically rather than counted directly.
- Reported as
- TCID₅₀/mL
- Key controls
- Uninfected replicates · positive infection control · a stated endpoint definition · a stated calculation method (Reed-Muench or Spearman-Karber)
Does not prove: a count of infectious particles. The value depends on the cell system, number of replicates, dilution design, endpoint definition, observation period, and calculation method, so all of these must be reported alongside the number.
Read the full section →Antigen assays (ELISA, lateral flow, IFA, IHC)
Antigen- Measures
- One or more viral proteins, using antibodies. Formats run from lateral-flow strips and plate ELISA through to immunofluorescence and tissue immunohistochemistry.
- Reported as
- Positive or negative, or a signal ratio, concentration, or assay-specific unit
- Key controls
- Isotype or irrelevant-antibody control · known positive and negative specimens · matrix-matched blank · wash adequacy check
Does not prove: absence of infection when negative, since antigen assays are usually less sensitive than nucleic acid amplification. Interpret a positive against the intended use, the prevalence setting, the confirmatory algorithm, and known cross-reactivity.
Read the full section →Serology (IgM, IgG, total antibody)
Serology- Measures
- Host antibodies raised against selected viral antigens.
- Reported as
- Reactive or non-reactive, or a titer, index, or concentration
- Key controls
- Known reactive and non-reactive sera · cut-off calibrator · paired specimens where seroconversion is the question
Does not prove: current infection, infectiousness, or protection. Antibodies may be undetectable early, IgM does not always mean acute infection, and IgG may reflect past infection, vaccination, or both. Related viruses cross-react, and immunocompromised hosts may respond weakly, late, or not at all.
Read the full section →Neutralization assays (PRNT, microneutralization, pseudovirus)
Serology- Measures
- Whether antibodies reduce viral infection under defined laboratory conditions. This is functional activity, not simply binding.
- Reported as
- PRNT50, PRNT90, NT50, IC50, or another stated reduction threshold
- Key controls
- Virus back-titration · no-serum infection control · known neutralising and non-neutralising sera · cell viability control
Does not prove: a universal protective threshold. Results shift with virus strain, host cells, endpoint, complement, assay format, and the chosen reduction cut-off. Pseudovirus and authentic-virus results should not be assumed numerically identical.
Read the full section →Sequencing (Sanger, amplicon, whole-genome, metagenomic, long-read)
Genomic- Measures
- Viral sequence, for identification, lineage assignment, resistance-associated substitutions, transmission analysis, or detection of agents no targeted assay was designed to find.
- Reported as
- A consensus sequence, plus coverage, depth, and the consensus-calling rule used
- Key controls
- Extraction blank · library-preparation negative · known positive reference material · index and barcode controls · positive and negative bioinformatic datasets
Does not prove: infectivity. Metagenomic sequencing is also not “unbiased”. Call it target-agnostic, because extraction chemistry, depletion, library preparation, platform, reference database, and computational filters all shape what can be detected. Species, strain, isolate, genotype, lineage, clade, and variant are not synonyms.
Read the full section →Microscopy, immunofluorescence, IHC, in situ hybridization, EM
Imaging- Measures
- Where viral particles, proteins, or nucleic acids sit within cells and tissue. This is spatial information that extracted nucleic acid tests destroy.
- Reported as
- Descriptive findings, staining pattern, or particle morphology
- Key controls
- Uninfected tissue · isotype control · probe-specificity control · consistent fixation and antigen retrieval
Does not prove: viral identity from morphology alone. Similar-looking particles may belong to different viruses, or may not be viruses at all. Electron microscopy is further limited by specimen concentration, preparation artifacts, cost, and operator expertise.
Read the full section →Use the narrowest method that can answer your question reliably, then add a complementary method where an important uncertainty remains. The strongest conclusions come from methods that answer different questions: PCR detects the target, sequencing confirms its identity, culture demonstrates infectivity, and serology shows that the host responded.
The Virology Workflow: From Specimen to Result
A dependable virology workflow usually follows seven connected stages. Before any of them, decide what the goal actually is: detection, identification, quantification, isolation, immune-response measurement, genetic characterization, or phenotypic testing. A failure early in the process can invalidate everything that follows.
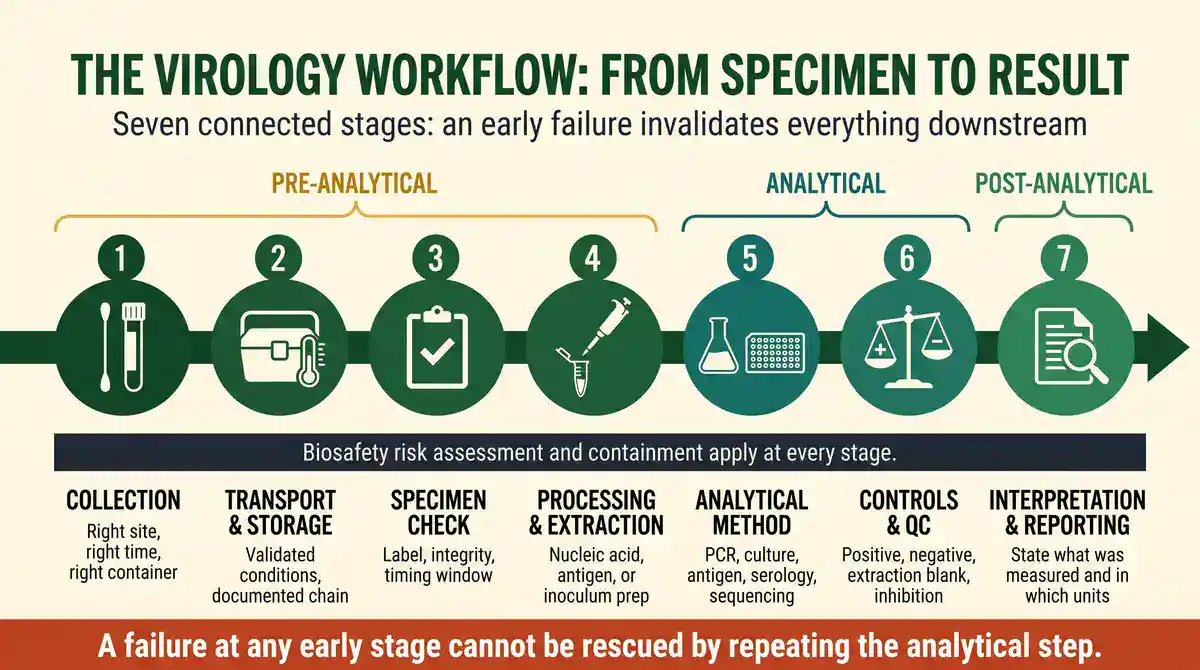
- Collection. The right site, at the right time, in the right container. A specimen taken from the wrong anatomical site or outside the useful detection window cannot be rescued by any downstream method. Timing also determines which test is informative: a direct viral test during active shedding, an antibody test later.
- Transport and storage. Transport medium, temperature, time to receipt, and freeze-thaw history all affect recovery. Requirements must come from the validated assay, an authoritative public health protocol, or an institution-approved procedure. There is no universal transport condition.
- Specimen check. Confirm identity, labelling, volume, and integrity on receipt, and record whether the sample falls inside the window the assay was validated for. Flag or reject before analysis rather than after.
- Processing and extraction. Depending on the method this may include clarification, concentration, filtration, nucleic acid extraction, fixation, inactivation, dilution, or transfer into a validated assay matrix. Every step can lose target or introduce contamination.
- Analytical method. The measurement itself: PCR or RT-PCR, quantitative or digital PCR, virus isolation, an infectivity assay, antigen detection, serology, neutralization, sequencing, or microscopy.
- Controls and quality control. Controls must address contamination, extraction efficiency, amplification and inhibition, cell health, reagent performance, and assay specificity, each with a stated acceptance criterion and a defined action when it fails.
- Interpretation and reporting. State what the assay measured, which units were used, whether controls passed, and what the result cannot establish.
Biosafety risk assessment is not a stage in this sequence. It applies to all seven, and is covered separately below.
Specimen Collection, Transport, and Pre-Analytical Control
The pre-analytical stage includes everything that happens before the final measurement. It often determines whether a virology test succeeds.
Viruses differ in tissue tropism, shedding pattern, environmental stability, genome type, envelope structure, and concentration during infection. A suitable specimen for one virus or stage of infection may be unsuitable for another. Collection timing can also change which test provides the most useful answer. A direct viral test may be most informative during active shedding, while an antibody test may become informative later.
Collection and transport requirements must come from a validated assay, an authoritative public health protocol, or an institution-approved procedure. There is no universal transport condition that applies to every virus and every analytical method.
Information Worth Recording for Every Specimen
- Unique specimen identifier
- Host species and relevant sample source
- Anatomical site or environmental source
- Collection date and time
- Collection device and transport medium
- Time between collection and processing
- Storage conditions and freeze-thaw history
- Visible leakage, contamination, desiccation, hemolysis, or other quality problems
- Requested test and suspected target, where appropriate
- Relevant clinical, epidemiological, experimental, or exposure metadata
- Deviations from the approved collection or transport procedure
An assay cannot recover information that poor sampling destroyed. Repeating the analytical step will not fix a specimen collected from the wrong site, transported incorrectly, mislabeled, contaminated, or obtained outside the useful detection window.
Biosafety in Virology Laboratories
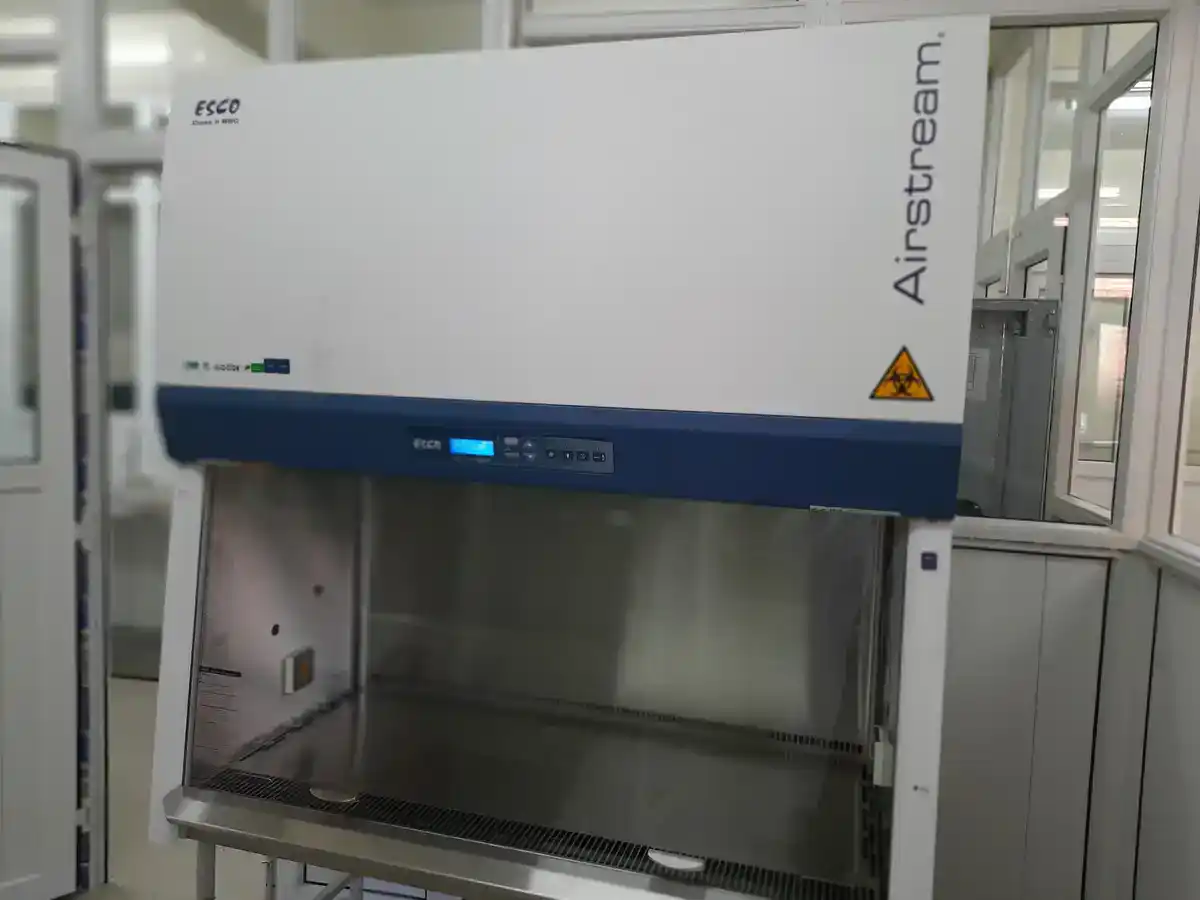
Virology biosafety should begin with a documented risk assessment rather than a guessed biosafety level. The assessment must consider both the biological material and the procedures being performed.
The CDC and NIH Biosafety in Microbiological and Biomedical Laboratories, Sixth Edition identifies agent hazards and laboratory-procedure hazards as the two broad starting points for biological risk assessment. The WHO Laboratory Biosafety Manual, Fourth Edition also uses an evidence-based, risk-based approach in which control measures reflect the actual work being undertaken.
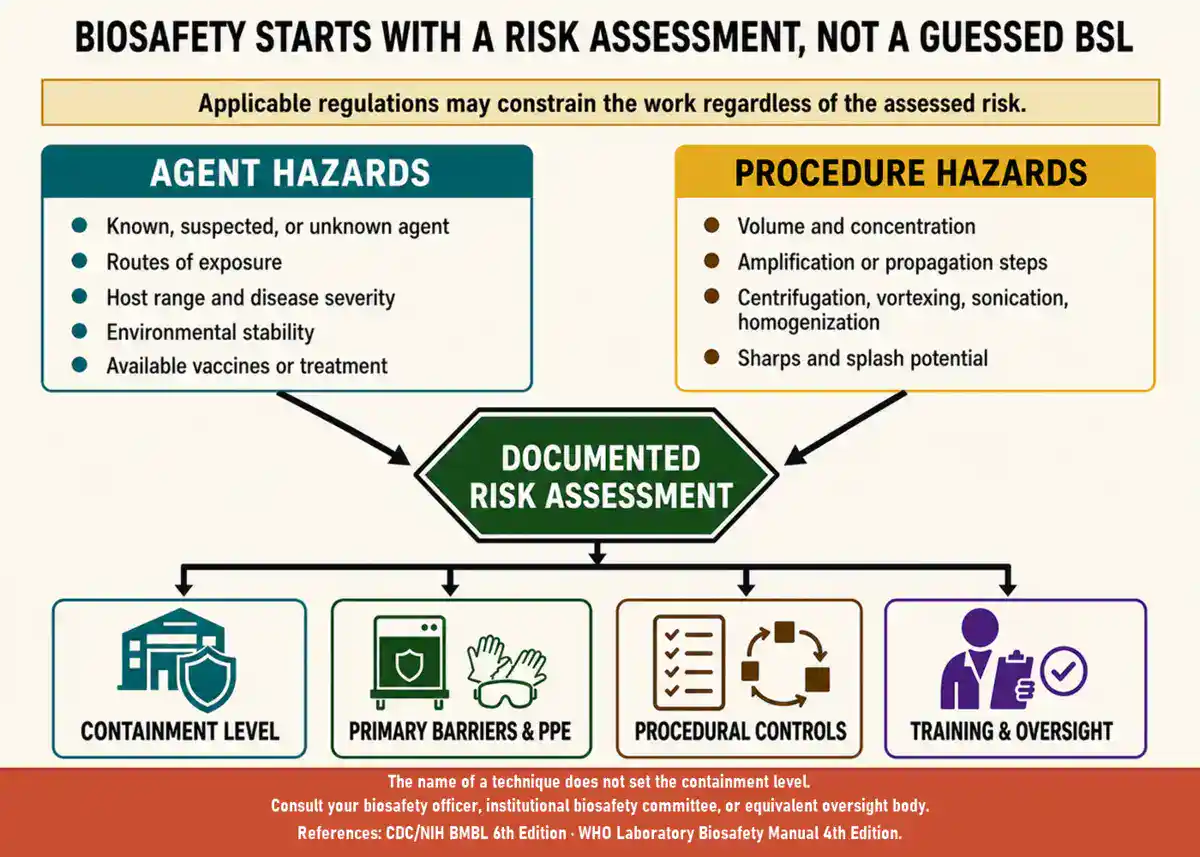
A risk assessment may need to consider:
- Whether the agent is known, suspected, or unknown
- Routes of exposure, including aerosols, splashes, sharps, ingestion, and contact with damaged skin
- Volume and concentration of biological material
- Whether a procedure could amplify or propagate infectious virus
- Centrifugation, vortexing, pipetting, sonication, homogenization, or other aerosol-generating steps
- Host range, disease severity, environmental stability, and available preventive measures
- Facility design, primary containment, personal protective equipment, and decontamination capacity
- Training, competency, supervision, emergency response, and incident reporting
- Applicable regulations governing possession, transport, import, export, animal work, or genetic modification
The name of a technique does not determine the required containment. Extracting nucleic acid from validated, inactivated material may present a different risk from propagating replication-competent virus. Likewise, diagnostic specimens may contain unexpected agents. Laboratories should consult their biosafety professional, institutional biosafety committee, public health authority, or equivalent oversight body before starting work.
Virus Isolation and Cell Culture
Virus isolation attempts to recover infectious virus by introducing a specimen into a susceptible biological system. Depending on the virus and purpose, that system may involve cultured cells, embryonated eggs, specialized tissues, organoids, plants, bacterial hosts, or an approved animal model.
Cell culture remains important because it can provide a live isolate for identification, antigenic characterization, antiviral testing, vaccine research, pathogenesis studies, and genome analysis. However, culture is not a universal detection method. Some viruses grow poorly, require specialized host cells, produce little visible damage, or cannot be cultivated routinely.
Cytopathic Effect
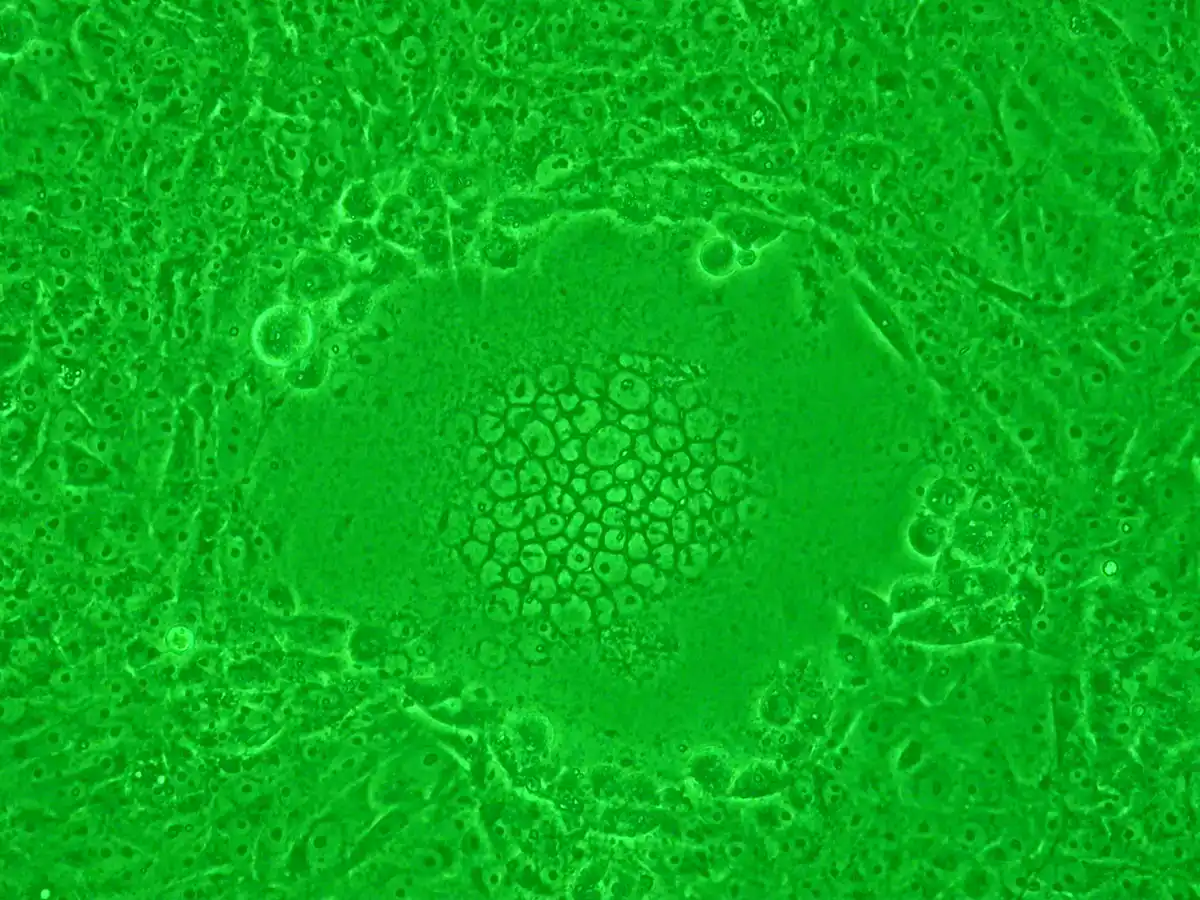
A cytopathic effect, commonly shortened to CPE, is a visible change in infected cells. Examples may include rounding, detachment, fusion, inclusion bodies, altered refractility, or destruction of a cell monolayer. The appearance and timing depend on the virus, cell type, inoculum, culture conditions, and observer.
CPE can suggest viral growth, but it is rarely sufficient for final identification. Toxic specimens, damaged cultures, contamination, and unrelated viruses may produce similar changes. Confirmatory methods can include immunostaining, PCR, sequencing, hemadsorption, or another validated identification assay.
Advantages and Limitations of Virus Culture
| Advantages | Limitations |
|---|---|
| Can demonstrate replication-competent virus | Not every virus grows in routine culture |
| Produces material for additional characterization | May take longer than direct molecular or antigen testing |
| Supports phenotypic antiviral and neutralization assays | Requires a suitable and healthy host system |
| Can reveal unexpected growth when targeted tests miss the agent | May require enhanced containment and specialized training |
| Allows study of replication and virus-host interactions | A negative culture does not necessarily exclude infection |
The ATCC Virology Culture Guide provides a useful overview of cell-based virus propagation, preservation, and titering principles.
Plaque Assays, Focus-Forming Assays, and TCID50
Virologists use infectivity assays when they need to measure the ability of virus in a sample to initiate infection in a selected host-cell system.
Plaque Assay
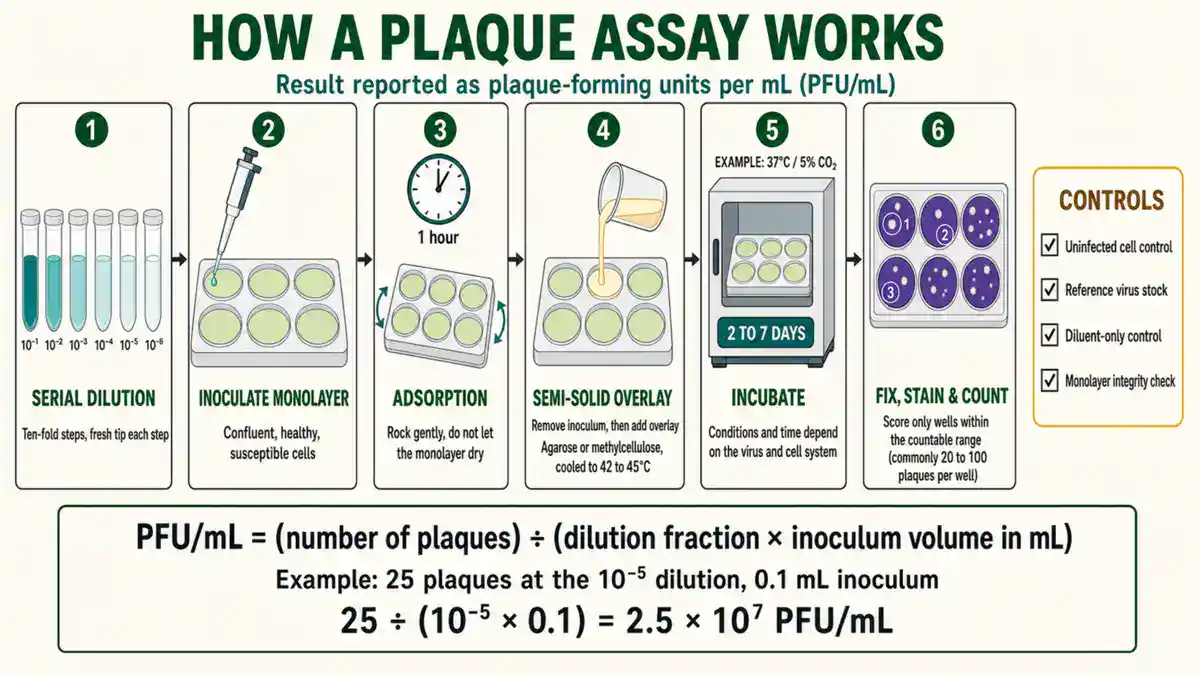
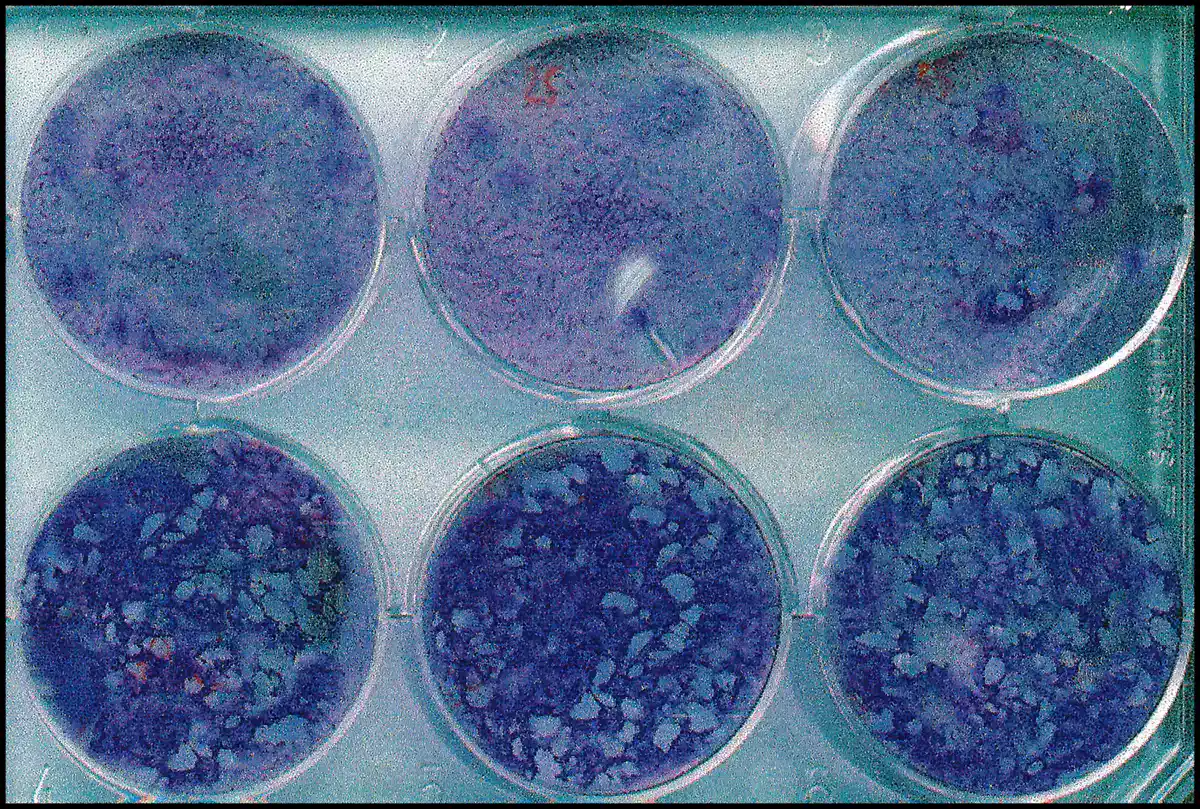
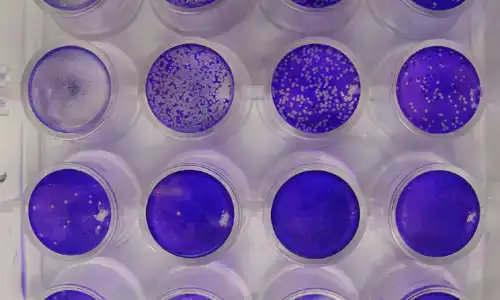
A plaque assay measures localized infectious events in a susceptible cell monolayer. Restricted spread causes discrete areas of infection or cell destruction called plaques. The result is usually reported as plaque-forming units per unit volume, such as PFU/mL.
A plaque-forming unit is an operational assay measurement. It should not be described as a direct count of every physical virion in the sample. Particle aggregation, incomplete particles, damaged virions, host-cell susceptibility, and assay conditions can all affect plaque formation.
Focus-Forming Assay
A focus-forming assay detects clusters of infected cells using virus-specific antibodies or another reporter. Because it does not always require visible cell destruction, it can quantify viruses that produce weak plaques or allow an earlier endpoint. Results are commonly expressed as focus-forming units, or FFU, per unit volume.
TCID50 Assay
The 50% tissue culture infectious dose, or TCID50, is estimated from an endpoint dilution assay. Replicate cultures receive different sample dilutions, and the analysis estimates the dilution at which 50% of inoculated cultures meet the defined infection endpoint.
The endpoint may be visible CPE, antigen detection, reporter expression, or another validated sign of infection. Results depend on the cell system, number of replicates, dilution design, endpoint definition, observation period, and calculation method.
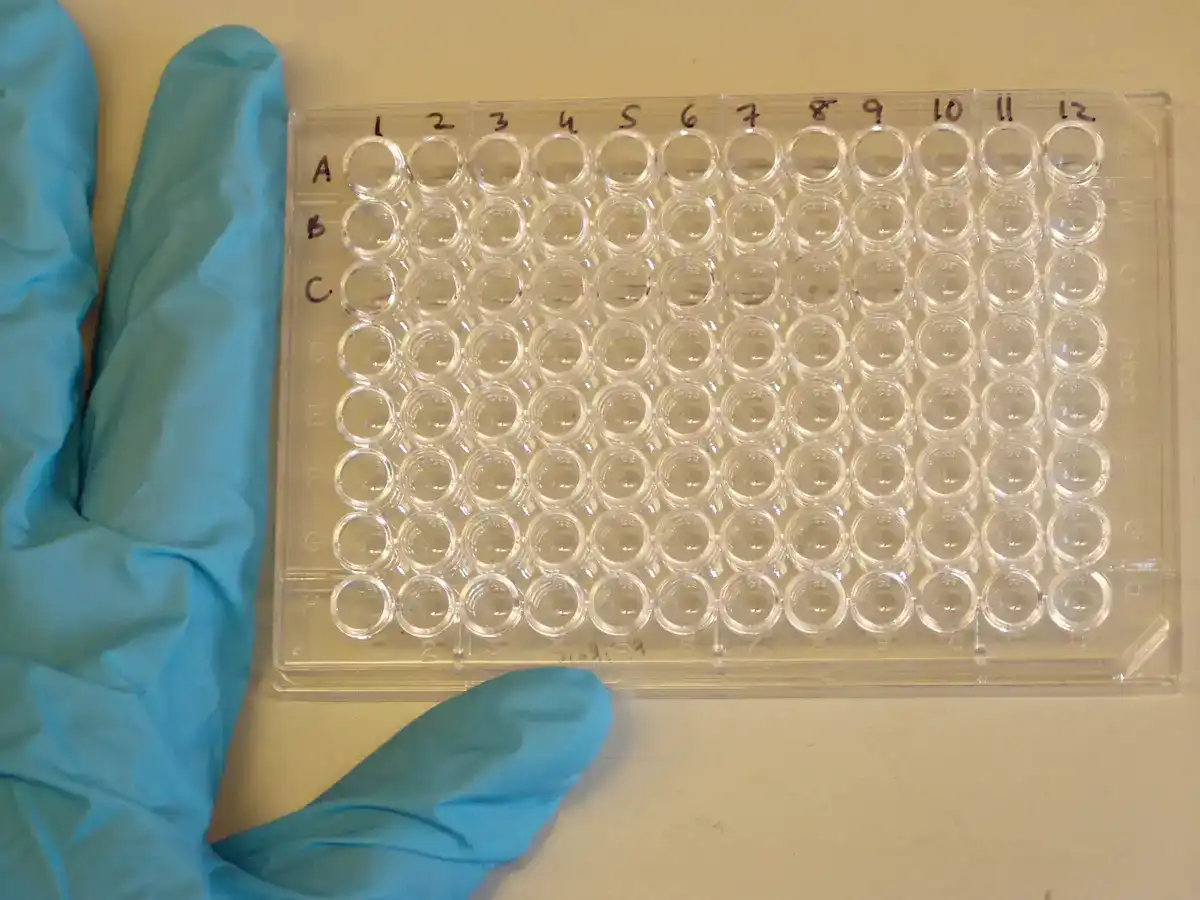
PFU, FFU, and TCID50 are related measures of infectivity, but they are not interchangeable units. A conversion factor derived for one virus-cell-assay combination should not be treated as a universal biological constant.
Hemagglutination and Hemadsorption Assays
Some viruses contain surface proteins that bind red blood cells. A hemagglutination assay detects the ability of free viral particles to cross-link red blood cells and produce a visible agglutination pattern. A hemadsorption assay detects red blood cells binding to virus-infected cells that express a suitable viral protein on their surfaces.
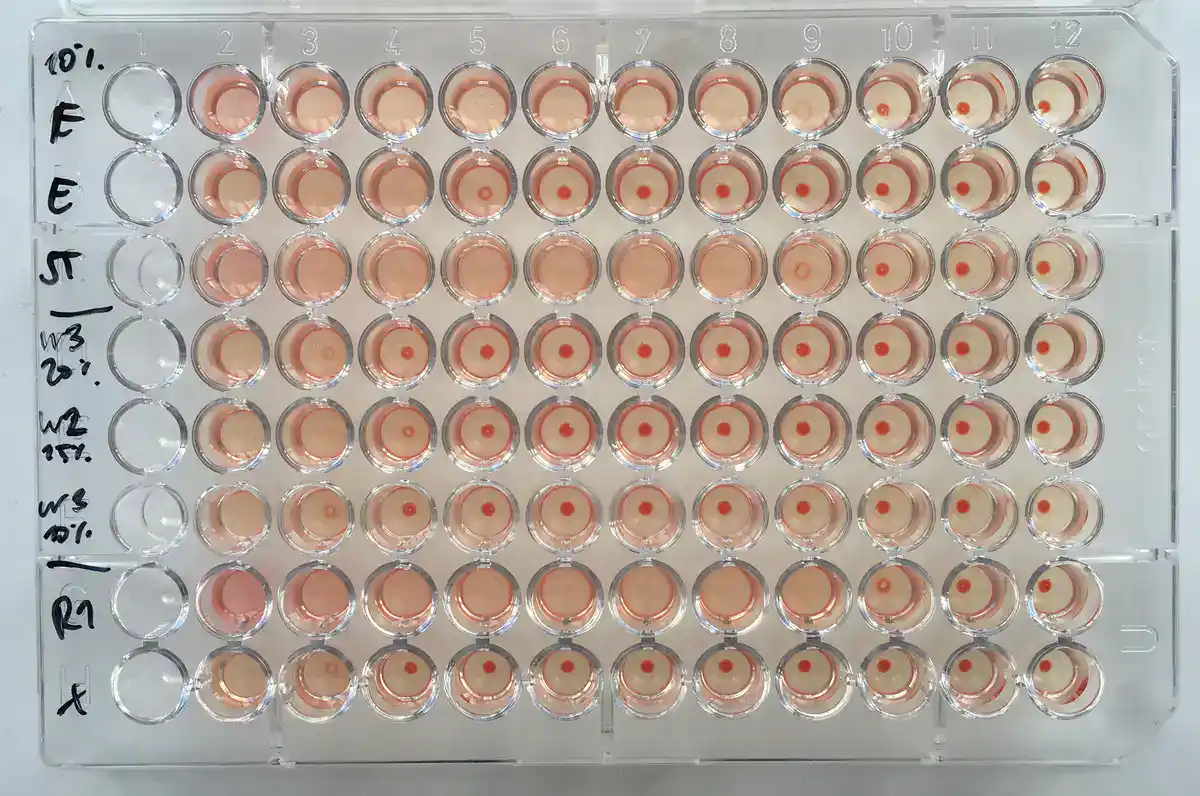
These methods have played important roles in influenza and other virus systems. However, hemagglutination units do not directly equal infectious units. Noninfectious particles may still contain functional hemagglutinating proteins, while assay performance also depends on the red blood cell source and test conditions.
A hemagglutination-inhibition assay measures whether antibodies prevent virus-mediated red blood cell agglutination. It is an antigenic or serological measurement, not a direct replacement for every neutralization assay.
Viral Antigen Detection
Antigen tests detect viral proteins using antibodies. Formats include enzyme-linked immunosorbent assays, chemiluminescent immunoassays, lateral-flow tests, immunofluorescence assays, immunohistochemistry, and antigen-capture platforms.
Antigen detection can provide a faster result than culture and may require less complex instrumentation than molecular amplification. Performance depends on viral protein abundance, antibody specificity, specimen type, timing, sample quality, and the assay's detection limit.
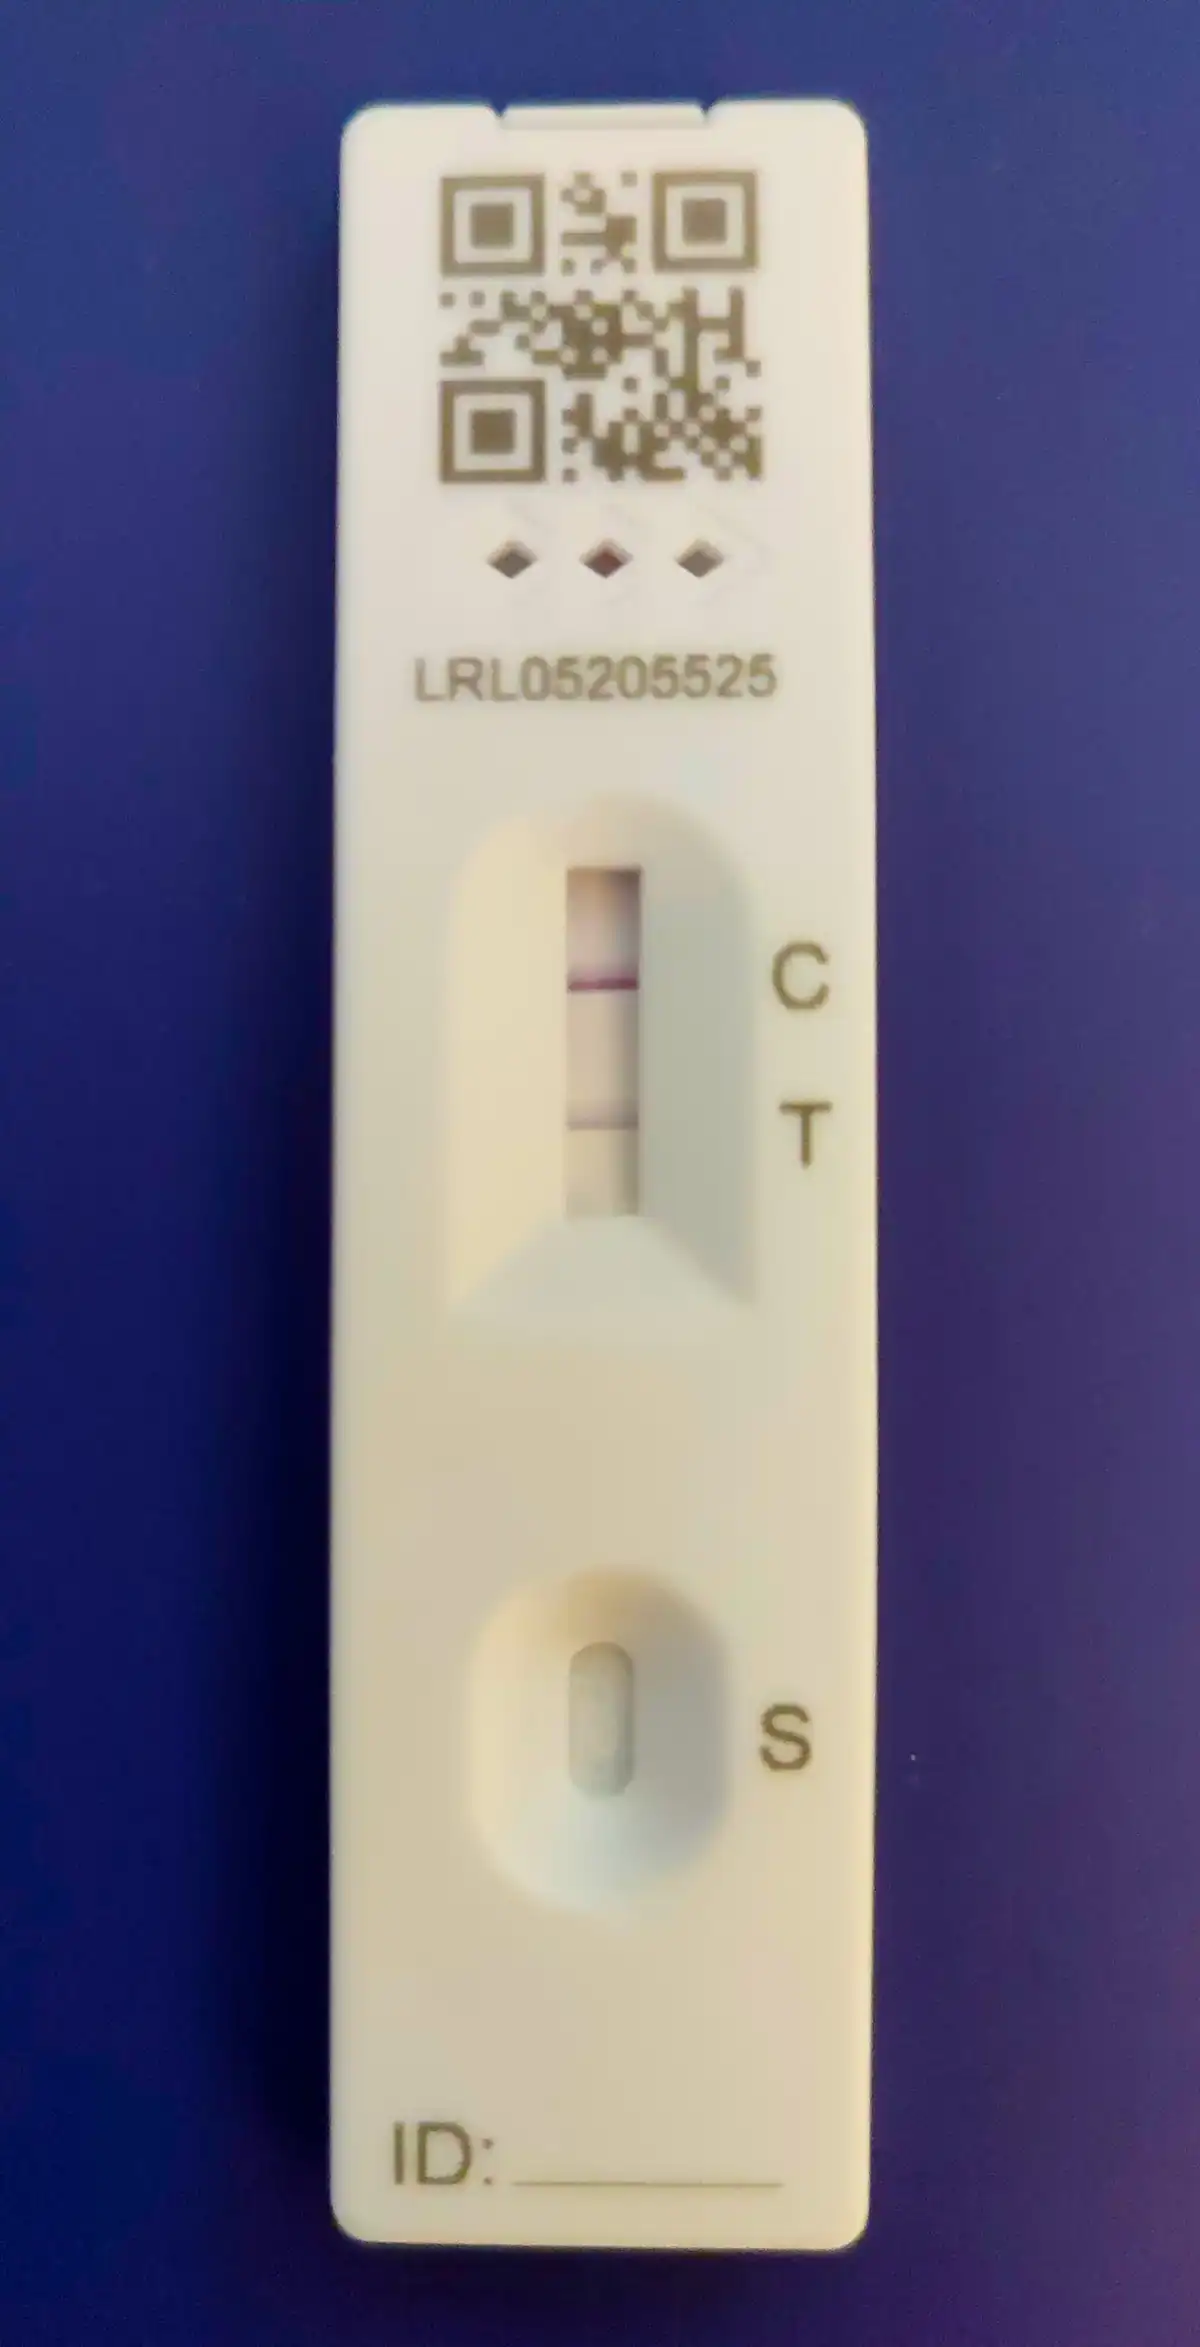
A negative antigen result cannot automatically exclude infection. A positive result also requires interpretation within the test's intended use, prevalence setting, confirmatory algorithm, and known cross-reactivity.
Serology and Viral Antibody Testing
Viral serology detects antibodies produced by the host. Common targets include virus-specific IgM, IgG, total antibody, or antibodies against selected viral proteins.
Serology may help document previous infection, recent immune response, vaccination response, seroconversion, population exposure, or immune status. Its interpretation varies considerably among viruses.
Important Serology Limitations
- Antibodies may not yet be detectable early in infection.
- IgM does not always prove a new or acute infection.
- IgG may reflect previous infection, vaccination, or both.
- Related viruses may produce cross-reactive antibodies.
- Immunocompromised hosts may have delayed, weak, or absent antibody responses.
- Different assays may target different antigens and produce different interpretations.
- A single antibody result may be less informative than paired specimens collected at meaningful times.
Neutralization Assays
Neutralization assays evaluate whether antibodies reduce viral infection under laboratory conditions. Common formats include plaque-reduction neutralization tests, microneutralization assays, focus-reduction assays, and pseudovirus neutralization assays.
The plaque-reduction neutralization test, or PRNT, compares plaque formation in the presence and absence of diluted serum or another antibody preparation. It has served as a reference method in several flavivirus applications, although results remain sensitive to the virus strain, host cells, endpoint, complement, assay format, and reduction threshold. The CDC-hosted guidelines for dengue PRNT were developed to improve comparability among laboratories.
Pseudovirus assays replace the authentic virus entry system with an engineered, nonreplicating or replication-limited surrogate. They can reduce some biosafety demands and increase throughput, but pseudovirus and authentic-virus results should not be assumed to be numerically identical.
PCR and RT-PCR in Virology
Polymerase chain reaction amplifies a selected DNA target. DNA viruses can be tested directly after suitable nucleic acid preparation. RNA viruses require a reverse-transcription step that converts RNA into complementary DNA before amplification. This produces the term RT-PCR.
Conventional PCR usually detects the final amplification product after cycling, often through gel electrophoresis or another endpoint readout. Real-time PCR monitors amplification as it occurs through a fluorescent signal.
Qualitative and Quantitative Molecular Testing
- Qualitative PCR or RT-PCR: reports whether the selected target was detected under the assay's decision rules.
- qPCR: measures DNA amplification in real time.
- RT-qPCR: combines reverse transcription with quantitative real-time PCR for RNA targets.
- Multiplex PCR: detects more than one target in a reaction using distinguishable primer, probe, or signal systems.
- Broad-range PCR: targets conserved sequences shared among a wider viral group, followed by identification such as sequencing.
- Nested PCR: uses successive amplification rounds to increase target enrichment, but it also raises contamination concerns.
- Isothermal amplification: amplifies nucleic acids without conventional thermocycling and includes formats such as loop-mediated amplification.
A positive molecular result means the assay detected its target. It does not automatically establish active replication, viability, transmissibility, disease causation, or the presence of enough infectious virus to infect another host.
Likewise, a negative result does not prove that the virus was absent from the host. The specimen may have contained too little target, the target may have degraded, inhibitors may have affected amplification, genetic changes may have reduced primer or probe binding, or the wrong anatomical site may have been sampled.
RT-qPCR, Cq Values, and Viral Load
Quantitative real-time PCR generates an amplification curve. The quantification cycle, or Cq, is the cycle at which the measured fluorescence meets the assay's quantification rule. Some instruments and publications use Ct or Cp for related values, but current MIQE terminology favors Cq.
A lower Cq generally indicates that the reaction began with more amplifiable target than a comparable sample tested in the same validated system. However, a Cq number is not a universal viral-load unit.
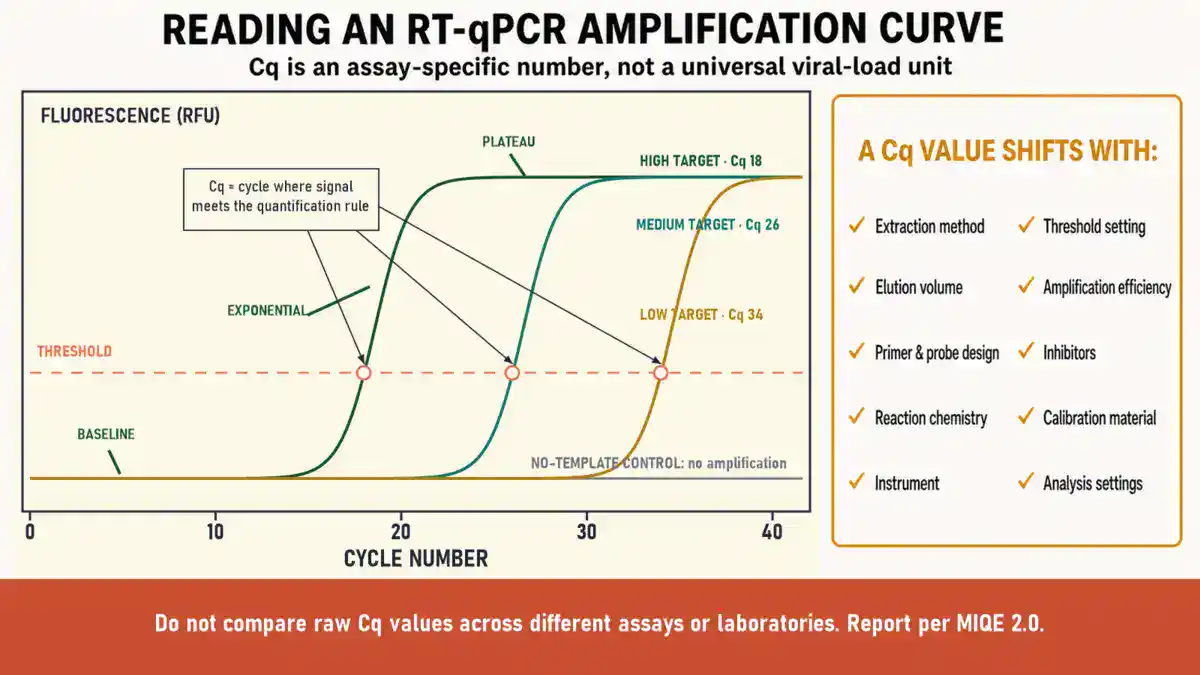
Cq values can change with extraction method, specimen volume, elution volume, target sequence, primer and probe design, reaction chemistry, instrument, fluorescence threshold, amplification efficiency, inhibitors, calibration material, and data-analysis settings. Comparing raw Cq values from different assays or laboratories can therefore be misleading.
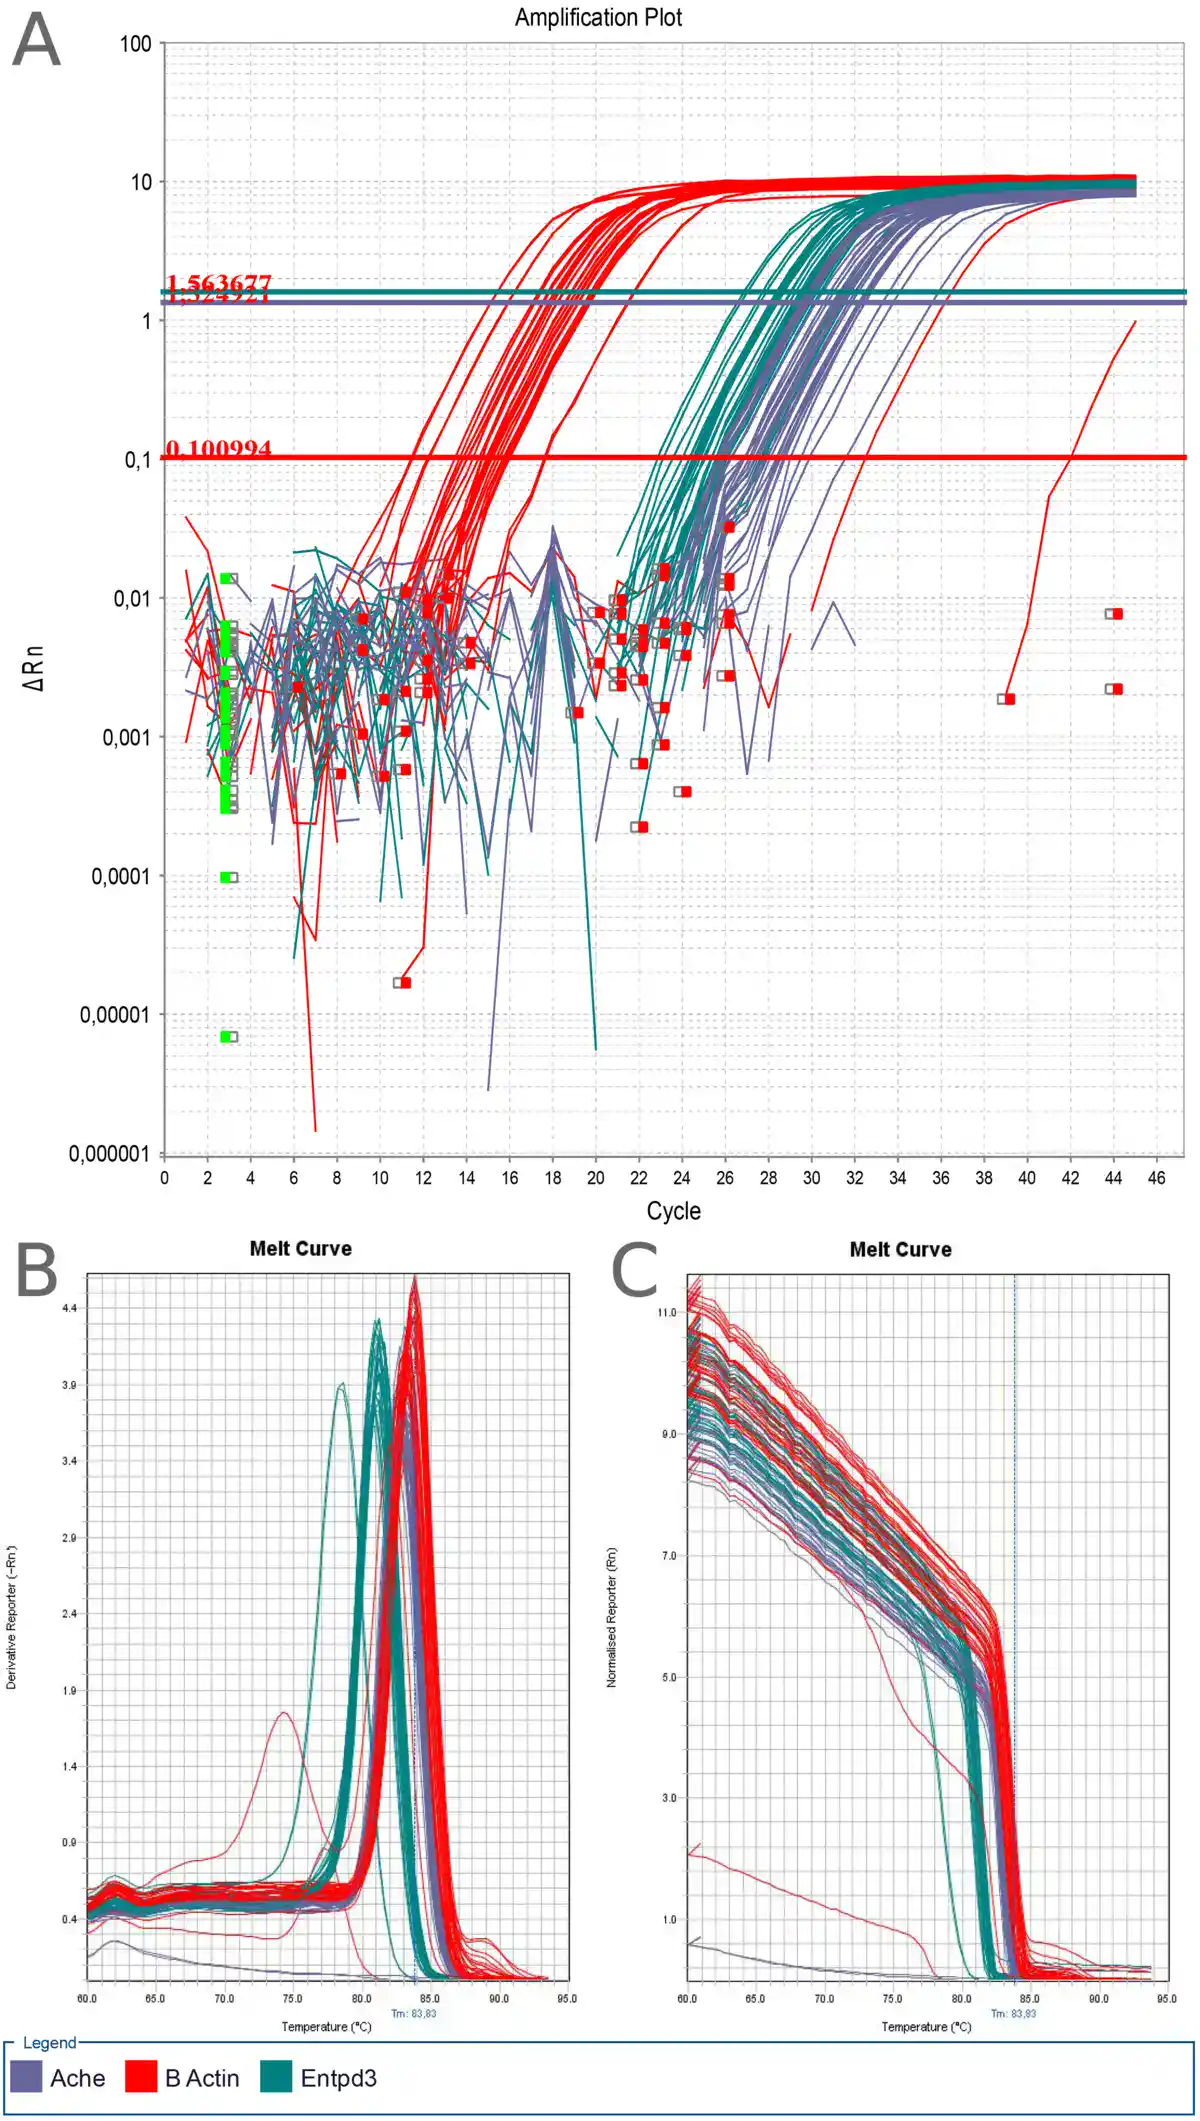
The MIQE 2.0 guidelines, published in 2025, emphasize transparent sample handling, assay validation, quality control, detection limits, dynamic range, efficiency-corrected quantities, data analysis, and complete reporting of qPCR experiments.
Digital PCR
Digital PCR, or dPCR, divides a sample into many small partitions. After amplification, each accepted partition is classified according to the assay's signal criteria. Statistical analysis estimates the target concentration while accounting for the probability that a partition initially contained more than one target molecule.
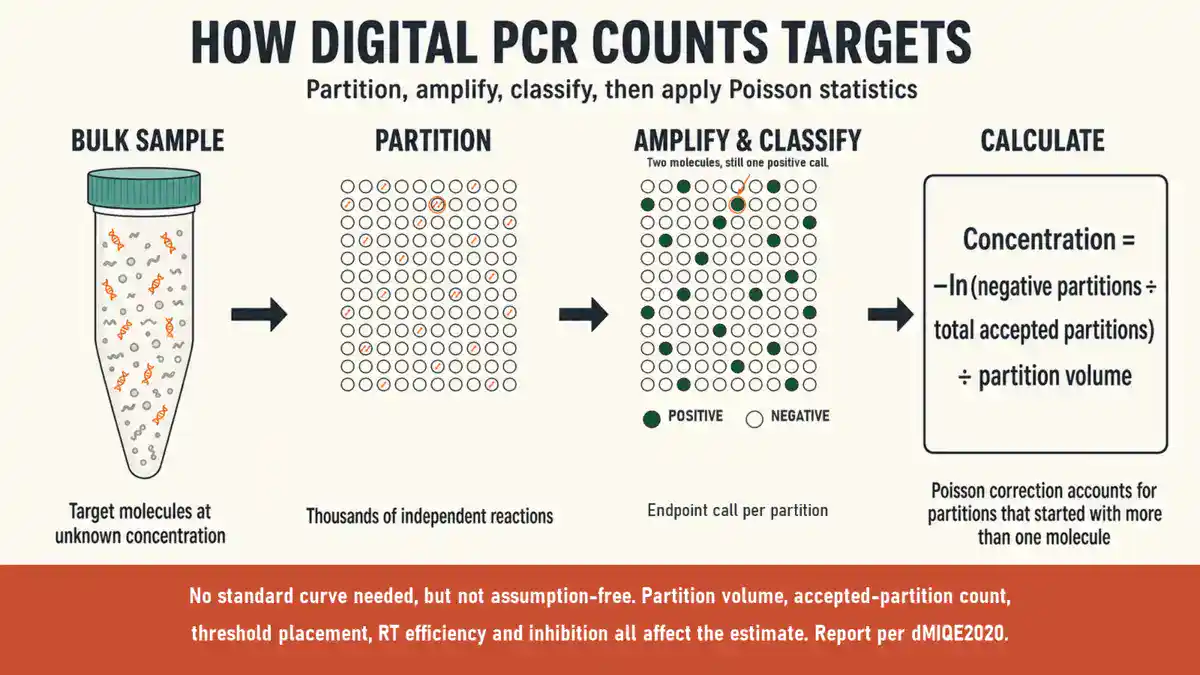
Digital PCR can quantify targets without a conventional external standard curve. That does not make the result assumption-free. Partition volume, accepted-partition count, threshold placement, molecular integrity, assay specificity, inhibition, reverse-transcription performance, and statistical model all affect the estimate.
The dMIQE2020 guidelines describe the minimum information needed to evaluate and reproduce digital PCR experiments.
Viral Genome Sequencing
Viral genome sequencing can identify a virus, characterize genetic variation, investigate transmission, monitor evolution, detect resistance-associated substitutions, support outbreak analysis, and reveal viruses that targeted assays were not designed to detect.
Major Sequencing Approaches
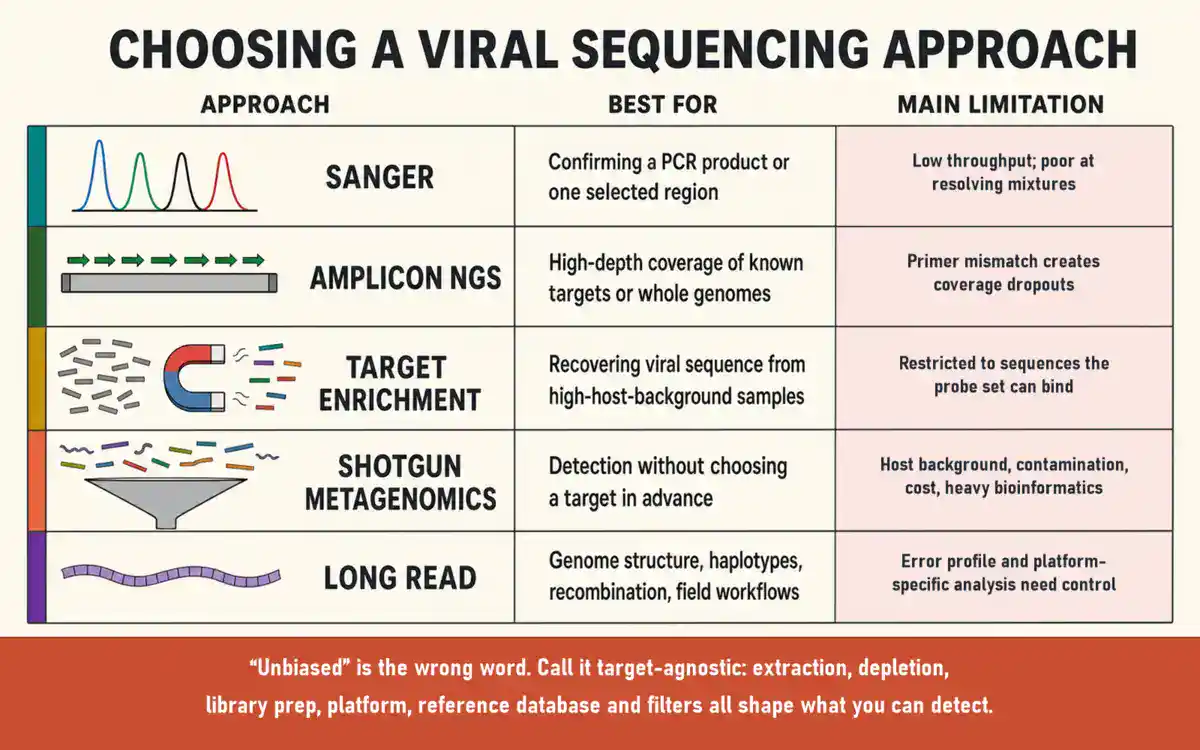
| Approach | Best suited for | Main limitation |
|---|---|---|
| Sanger sequencing | Confirming a PCR product or analyzing a selected genomic region | Limited throughput and weaker resolution of complex mixtures |
| Amplicon next-generation sequencing | High-depth sequencing of known targets or whole genomes covered by designed primer sets | Primer mismatch and amplification bias can create coverage gaps |
| Target-enrichment sequencing | Increasing recovery of selected viral sequences from samples with abundant host material | Restricted to sequences captured by the enrichment design |
| Shotgun metagenomic sequencing | Broad detection without selecting one viral target in advance | Host background, contamination, cost, and bioinformatic interpretation can limit sensitivity |
| Long-read sequencing | Genome structure, haplotypes, long amplicons, recombination, and rapid field-oriented workflows | Error profile, coverage, sample preparation, and platform-specific analysis require careful control |
Metagenomic sequencing is sometimes described as unbiased. A better description is target-agnostic or hypothesis-light. Extraction chemistry, nuclease treatment, depletion, library preparation, sequencing platform, reference database, and computational filters still shape which sequences can be detected.
Sequencing Quality Information to Report
- Specimen source and preparation method
- Library-preparation strategy
- Primer or capture-panel version
- Sequencing platform and chemistry
- Read-quality filtering and trimming
- Reference sequence and accession
- Genome coverage breadth and depth
- Consensus-calling and minor-variant thresholds
- Contamination controls
- Software, database, and workflow versions
- Regions masked because of insufficient or unreliable data
- Raw-read and consensus-sequence accession numbers, where applicable
The WHO guide to implementing viral genomic sequencing explains how sequencing can support outbreak management and surveillance. Current virus names and taxonomic placement should be checked through the International Committee on Taxonomy of Viruses Taxonomy Browser.
Species, strain, isolate, genotype, lineage, clade, and variant are not interchangeable terms. Reports should use the term that matches the evidence and the relevant classification system.
Microscopy and Tissue-Based Virology Methods
Microscopy can reveal virion morphology, infected-cell changes, inclusion bodies, antigen distribution, or the tissue location of viral nucleic acids.
Light Microscopy and Histology
Routine staining can show tissue injury, inflammation, inclusion bodies, syncytia, and other changes associated with viral infection. These findings may support a diagnosis, but morphology alone is often insufficient to identify a specific virus.
Immunofluorescence and Immunohistochemistry
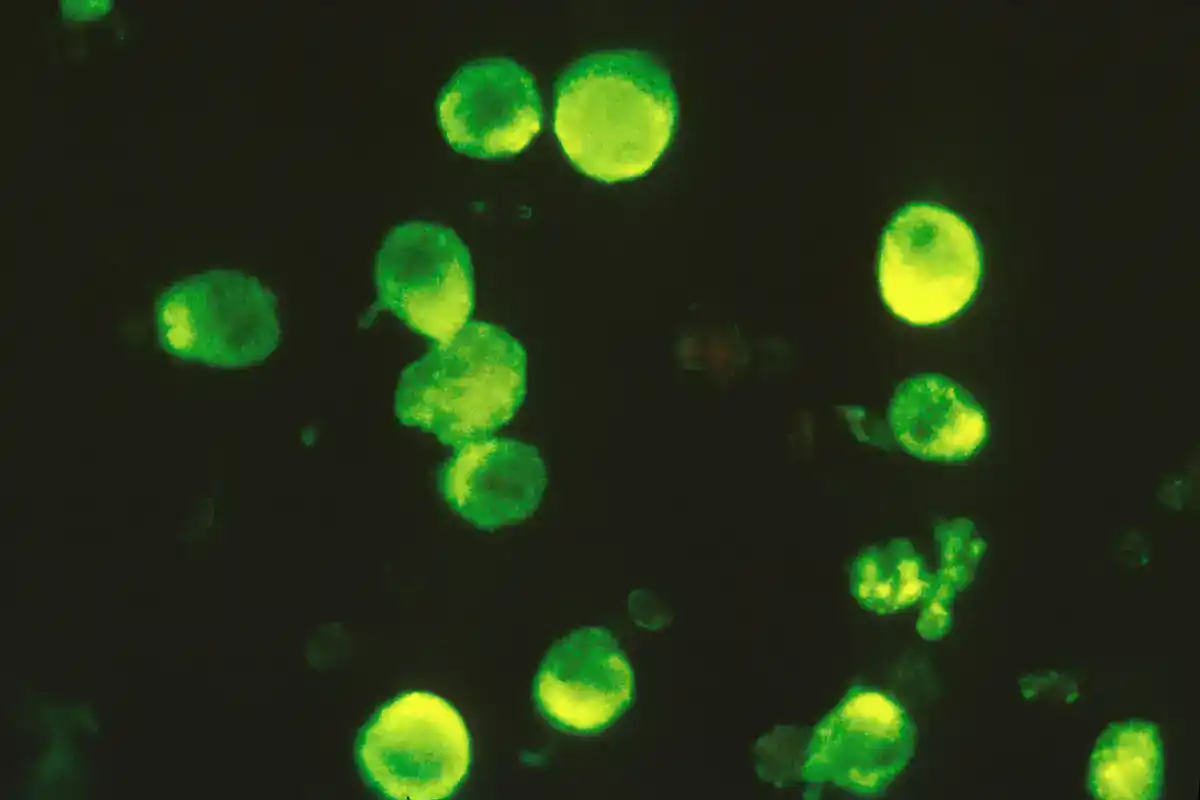
These methods use labeled antibodies to detect viral antigens in cells or tissues. They provide spatial information that extracted nucleic acid tests cannot provide. Their reliability depends on antibody specificity, fixation, tissue quality, antigen preservation, controls, and interpretation.
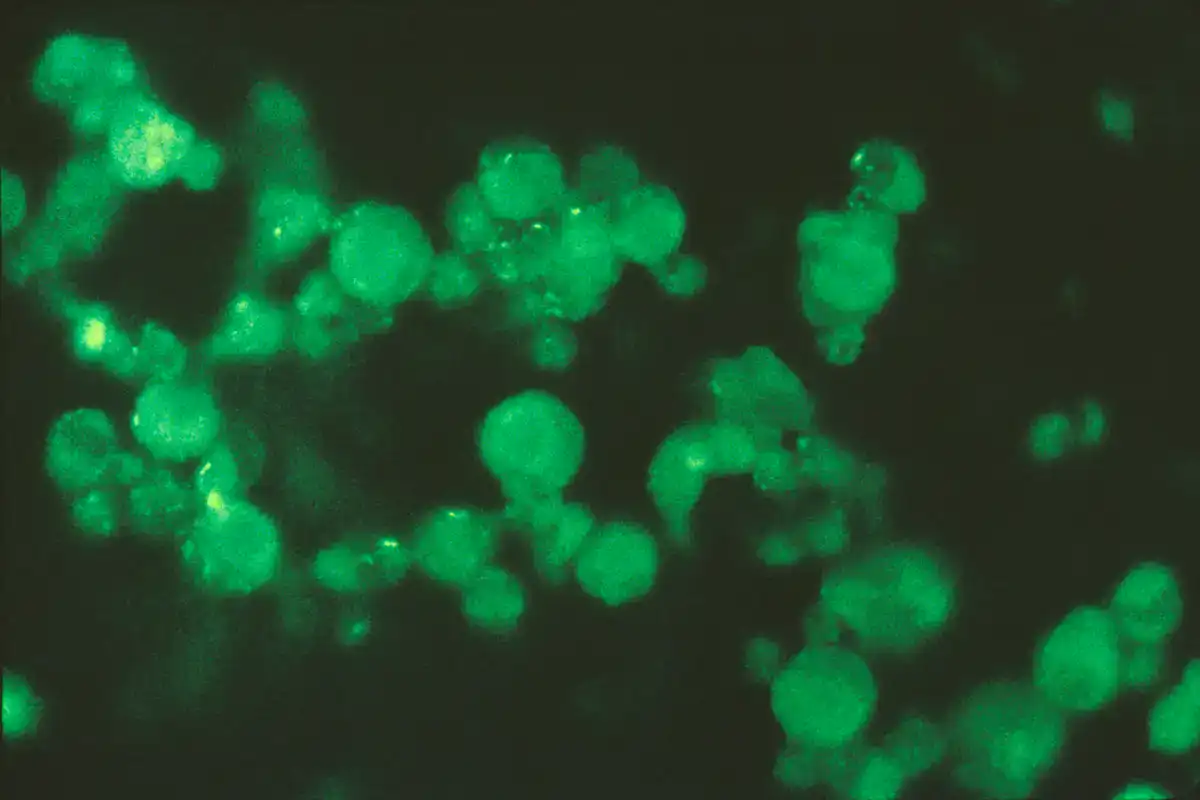
In Situ Hybridization
In situ hybridization uses labeled nucleic acid probes to locate selected viral sequences within cells or tissues. It can connect viral nucleic acid detection with histological context.
Electron Microscopy
Electron microscopy can visualize particles at a scale inaccessible to ordinary light microscopy. It has contributed greatly to viral discovery and structural virology. Direct diagnostic use is limited by specimen concentration, preparation artifacts, cost, expertise, and the fact that similar-looking particles may belong to different viruses or may not be viruses at all.
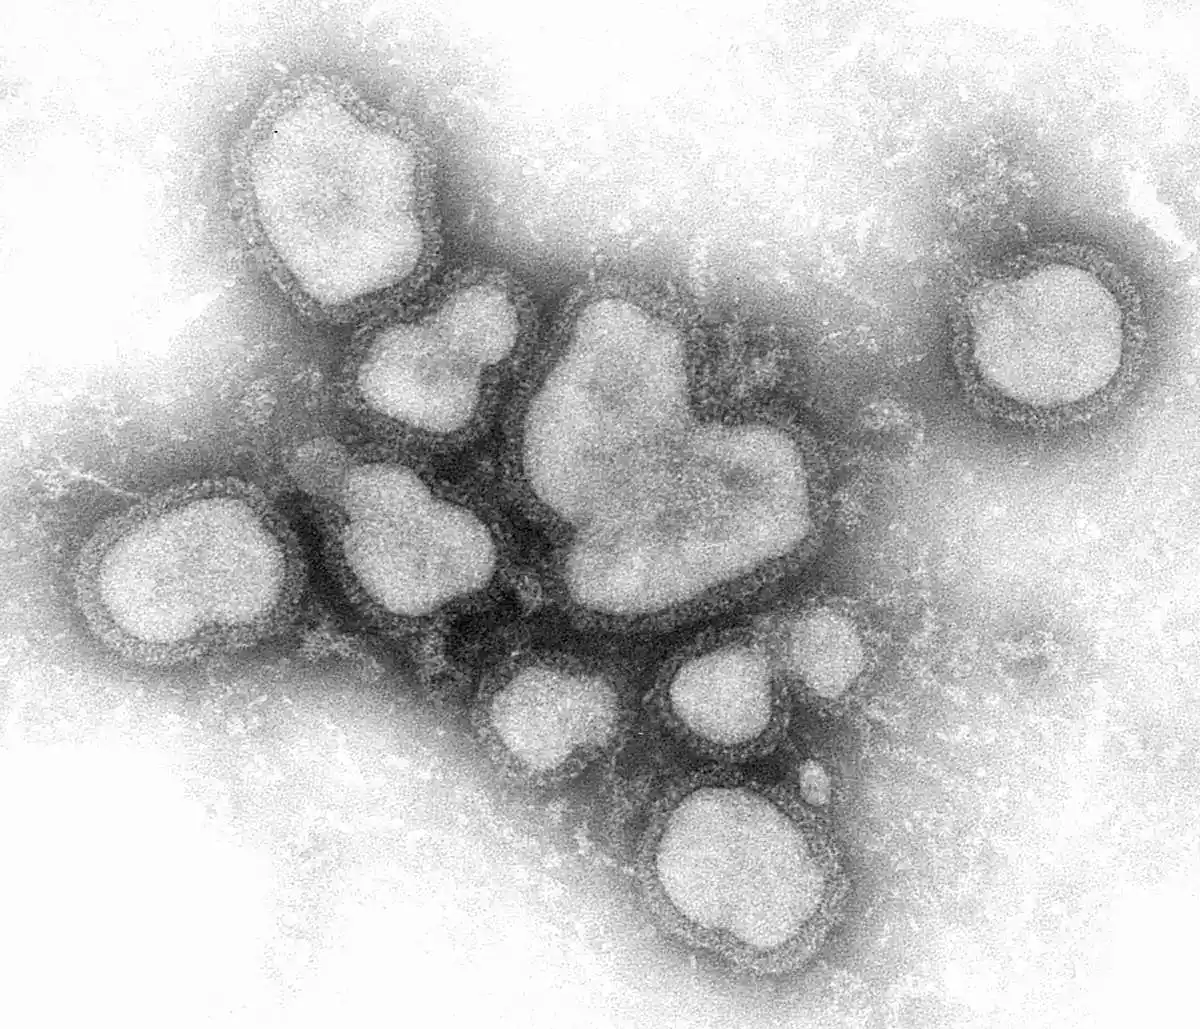
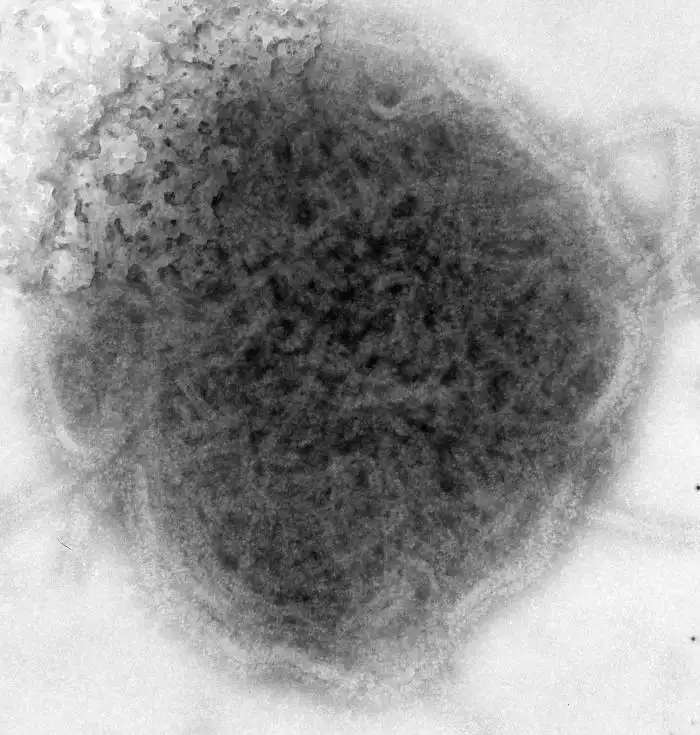
Cryogenic electron microscopy and electron tomography provide higher-resolution structural information for purified particles and carefully prepared specimens. These are advanced structural methods rather than routine replacements for PCR, culture, or sequencing.
Flow Cytometry, Reporter Assays, and Advanced Cell Models
Flow cytometry can measure the proportion of infected cells, viral antigen expression, cell viability, receptor abundance, or host immune responses. Reporter viruses and reporter cell lines generate measurable fluorescence, luminescence, or another signal following infection or viral entry.
Organoids, primary-cell cultures, air-liquid interface models, and induced pluripotent stem cell-derived systems can model aspects of tissue organization and host susceptibility that immortalized cell lines do not reproduce. They also introduce additional biological variability and validation requirements.
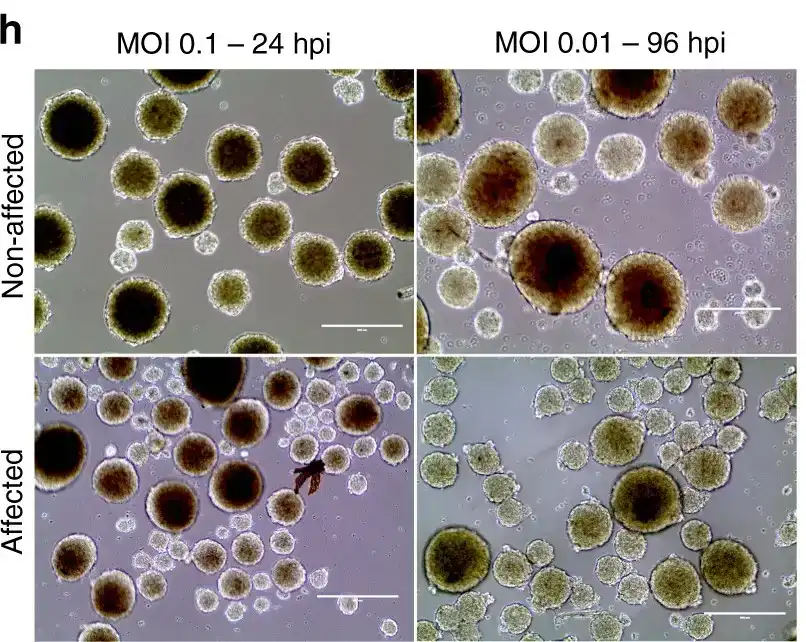
Single-cell sequencing, proteomics, spatial transcriptomics, and high-content imaging can reveal how individual cells respond differently to viral infection. These methods produce rich datasets, but interpretation still depends on experimental controls, batch management, statistical design, and independent validation.
Antiviral Susceptibility and Inhibition Assays
Antiviral testing asks whether a compound, antibody, interferon, or other treatment reduces a defined measure of viral infection or replication.
Common readouts include:
- Reduction in plaque or focus number
- Reduction in viral nucleic acid
- Reduction in antigen expression
- Reporter-signal inhibition
- Protection from virus-associated cell damage
- Reduction in infectious-virus yield
A treatment that lowers a molecular signal does not necessarily reduce infectious yield to the same degree. Likewise, a compound that damages cells can appear to reduce infection simply because fewer viable host cells remain. Antiviral assays therefore need matched cytotoxicity, cell-viability, vehicle, infection, and assay-background controls.
Genotypic resistance testing detects mutations associated with reduced drug susceptibility. Phenotypic testing directly measures the response of a virus or viral system to a treatment. Genotype can predict phenotype only when the relevant mutation-effect relationship has been established.
Viral Load, Virus Titer, and Particle Count Are Different
The phrase viral load is often used too loosely. A complete result should state what was measured and which units were used.
| Measurement | Example unit | What it represents |
|---|---|---|
| Nucleic acid target quantity | Copies/mL, international units/mL, or another calibrated unit | Amplifiable viral DNA or RNA target under the assay conditions |
| Plaque-forming titer | PFU/mL | Localized infectious events that form countable plaques |
| Focus-forming titer | FFU/mL | Localized infected-cell foci detected by staining or a reporter |
| Endpoint infectious dose | TCID50/mL | Statistically estimated dose producing the defined endpoint in 50% of cultures |
| Hemagglutination titer | HA units | Ability to agglutinate red blood cells under the assay conditions |
| Physical-particle measurement | Particles/mL | Particles detected by the selected physical or imaging method |
| Antigen concentration | Signal ratio, concentration, or assay-specific unit | Detected viral protein rather than whole infectious virus |
Genome copies may greatly outnumber infectious units because a preparation can contain damaged particles, incomplete genomes, neutralized virus, free nucleic acid, or particles unable to infect the chosen host cells. Conversely, extraction loss and amplification inhibition can cause molecular assays to underestimate the target present.
Researchers should report the actual measurement instead of presenting PFU, TCID50, genome copies, antigen signal, and particle count as though they describe the same biological quantity.
Controls Used in Virology Experiments
Controls do more than show that an instrument turned on. They help determine whether the specimen was processed correctly, whether the assay could detect its target, whether contamination occurred, and whether the result is biologically interpretable.
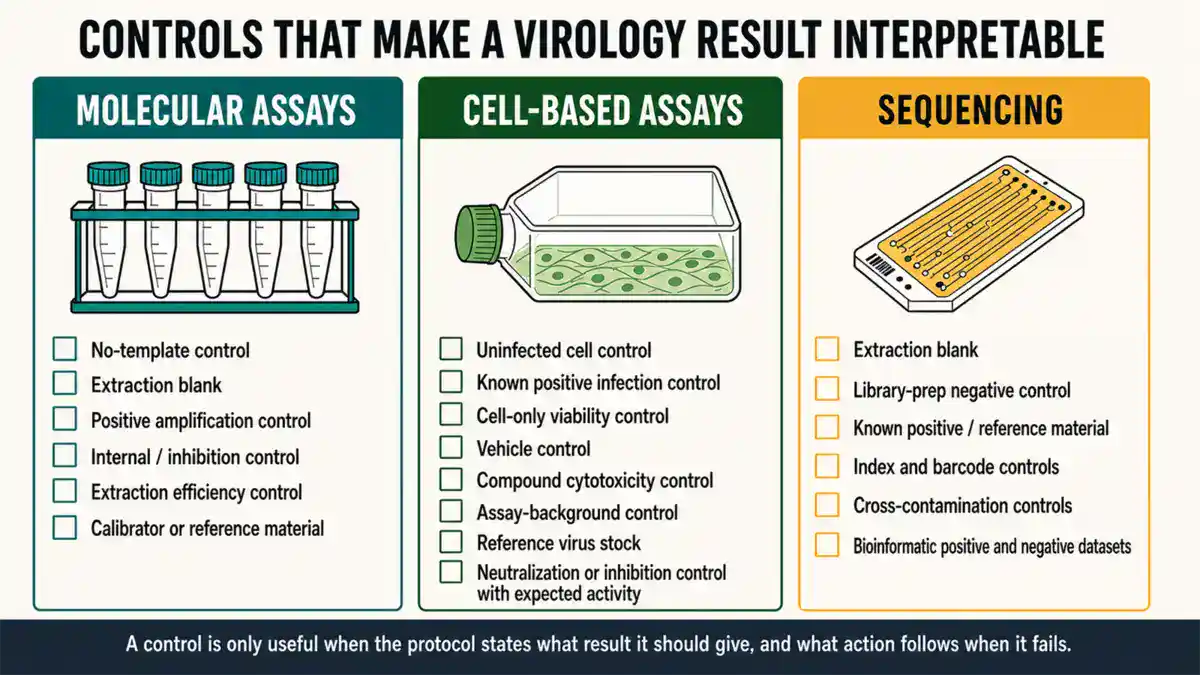
Molecular Assay Controls
- No-template control: checks amplification reagents for contamination.
- Extraction blank: travels through sample preparation and tests for contamination introduced before amplification.
- Positive amplification control: demonstrates that the target-detection system can generate the expected signal.
- Internal or inhibition control: helps identify inhibition or reaction failure in an individual sample.
- Extraction efficiency control: indicates how much target survives sample preparation.
- Calibrator or reference material: supports quantification and comparability when properly characterized.
Two further controls are worth defining where the workflow justifies them. A process control evaluates several stages at once, potentially including extraction, reverse transcription, and amplification. A matrix control tests how the specimen type itself affects recovery or detection.
Cell-Based Assay Controls
- Uninfected-cell control
- Known infected or positive-assay control
- Cell-only viability control
- Vehicle control
- Reagent or compound cytotoxicity control
- Assay-background control
- Reference virus or reference preparation, where appropriate
- Neutralization or inhibition control with expected activity
Sequencing Controls
- Extraction blank
- Library-preparation negative control
- Known positive or reference material
- Index and barcode controls
- Controls for cross-run or cross-sample contamination
- Bioinformatic negative and positive test datasets
A control is useful only when the protocol defines what result it should produce and what action follows when it fails.
Validating a Virology Method
Method validation asks whether an assay performs well enough for its intended use. A research assay, surveillance assay, manufacturing release test, environmental screen, and clinical diagnostic test may require different validation evidence and regulatory oversight.
Common performance characteristics include:
- Analytical sensitivity: the ability to detect low target concentrations.
- Limit of detection: the lowest concentration detected with a stated probability under defined conditions.
- Limit of quantification: the lower range at which quantitative results meet predefined performance criteria.
- Analytical specificity: the ability to detect the intended target without unacceptable interference or cross-reactivity.
- Inclusivity: detection of the intended diversity of target variants.
- Exclusivity: absence of unacceptable detection of nontarget organisms or sequences.
- Precision: agreement among repeated measurements.
- Repeatability: performance under closely matched conditions.
- Reproducibility: performance across relevant operators, runs, instruments, sites, or conditions.
- Linearity and reportable range: quantitative behavior across the intended measurement interval.
- Robustness: resistance to small, realistic procedural variations.
- Accuracy or agreement: comparison with an accepted reference method, material, or expected value.
- Interference: effects from specimen components, inhibitors, treatments, or contaminants.
Validation should use materials and matrices that reflect the intended specimens. A method validated with purified material may behave differently with mucus, blood, tissue homogenate, wastewater, plant sap, cell-culture medium, or another complex matrix.
Virology Troubleshooting Guide
| Problem | Questions to investigate |
|---|---|
| No molecular signal from samples or positive control | Did extraction, reverse transcription, reagent preparation, instrument setup, target design, or control material fail? |
| Positive sample has an unexpectedly late or variable Cq | Was the specimen degraded, inhibited, poorly mixed, inconsistently extracted, near the detection limit, or affected by pipetting variation? |
| Amplification appears in a negative control | Could contamination have entered during extraction, reagent preparation, plate setup, or post-amplification handling? |
| Cells deteriorate without expected infection | Are the specimen, solvent, treatment, medium, handling conditions, contamination, or cell health causing toxicity? |
| No CPE appears in virus culture | Is the host system permissive, was the specimen still infectious, does the virus produce visible CPE, and did the positive culture control behave correctly? |
| Plaques are merged, faint, uneven, or difficult to count | Was the countable range missed, was the monolayer inconsistent, did spread remain localized, and were staining and scoring criteria applied consistently? |
| Antigen or antibody assay has high background | Could nonspecific binding, matrix interference, inadequate washing, reagent deterioration, or signal saturation explain the result? |
| Sequencing coverage is low or uneven | Was target abundance low, nucleic acid degraded, host background excessive, primer binding poor, library quality inadequate, or read quality insufficient? |
| Unexpected organisms or sequences appear | Are they biologically plausible, reagent contaminants, barcode leakage, reference-database errors, environmental contamination, or pipeline artifacts? |
| Replicates disagree | Is the sample near the detection limit, heterogeneous, unstable, poorly mixed, affected by pipetting error, or scored using unclear acceptance rules? |
Troubleshooting should begin with the controls and raw data. Repeating a failed experiment without identifying the failed stage often reproduces the same failure.
How to Write a Reproducible Virology Protocol
A useful protocol should let another trained laboratory understand what was done, why it was done, how success was judged, and how failures were handled.
- Title, identifier, and version: Give the procedure a stable name, revision number, approval date, and document owner.
- Purpose and scope: State which question, specimens, targets, host systems, and applications the protocol covers.
- Limitations: Explain what the method cannot determine and which specimens or viruses fall outside its validation.
- Responsibilities and competency: Identify required training, supervision, authorization, and review.
- Risk assessment: Reference the approved biosafety evaluation and required controls.
- Specimen requirements: Define accepted specimen types, collection information, rejection criteria, transport, and storage.
- Materials and equipment: Record critical reagents, identifiers, instruments, software, and reference materials.
- Controls: List each control, expected result, acceptance range, and response to failure.
- Procedure: Describe the validated sequence of operations clearly enough for trained personnel to follow.
- Calculations: Define formulas, dilution factors, normalization, calibration, statistical methods, and rounding rules.
- Acceptance criteria: State how a valid run differs from an invalid or inconclusive run.
- Interpretation: Explain positive, negative, indeterminate, and out-of-range results.
- Troubleshooting and deviations: Describe permitted actions and how deviations must be documented.
- Data and records: Specify raw-data retention, file naming, audit trail, instrument exports, and result review.
- Decontamination and waste: Reference approved procedures appropriate to the risk assessment.
- References: Cite source methods, validation reports, standards, and manufacturer documentation.
Reporting Virology Results Clearly
A result should identify the measurement rather than force readers to infer it.
- Name the assay or methodological principle.
- Identify the target, antigen, sequence region, antibody class, or infectivity endpoint.
- State the specimen or experimental material.
- Use explicit units such as PFU/mL, FFU/mL, TCID50/mL, copies/mL, or international units/mL.
- Distinguish detected, not detected, inconclusive, invalid, and below the quantifiable range.
- Report dilution and normalization bases where they affect interpretation.
- State whether required controls passed.
- Record the assay version, reference sequence, software, and analysis settings when relevant.
- Describe deviations or limitations that may affect the result.
- Avoid claiming infectivity from molecular detection alone.
Raw amplification curves, plaque images, gating strategies, sequence coverage, consensus rules, and control results can be more informative than a final spreadsheet containing only processed numbers.
Choosing the Right Virology Method
Use the narrowest method that can answer the question reliably, then add a complementary method when the first result leaves an important uncertainty.
- For rapid detection of a known viral sequence, consider a validated PCR or RT-PCR assay.
- For quantitative nucleic acid measurement, use qPCR, RT-qPCR, or dPCR with suitable calibration and controls.
- For proof of infectious virus, use an appropriate culture-based infectivity method.
- For infectious-virus quantification, choose a plaque, focus-forming, or endpoint dilution assay that the virus-host system supports.
- For viral protein detection, use a validated antigen assay.
- For evidence of host antibody response, use serology interpreted against timing and cross-reactivity.
- For functional antibody activity, use a suitable neutralization assay.
- For genetic characterization, use targeted or whole-genome sequencing.
- For an unexpected or unknown virus, combine broad molecular methods, sequencing, microscopy, culture, and confirmatory testing as appropriate.
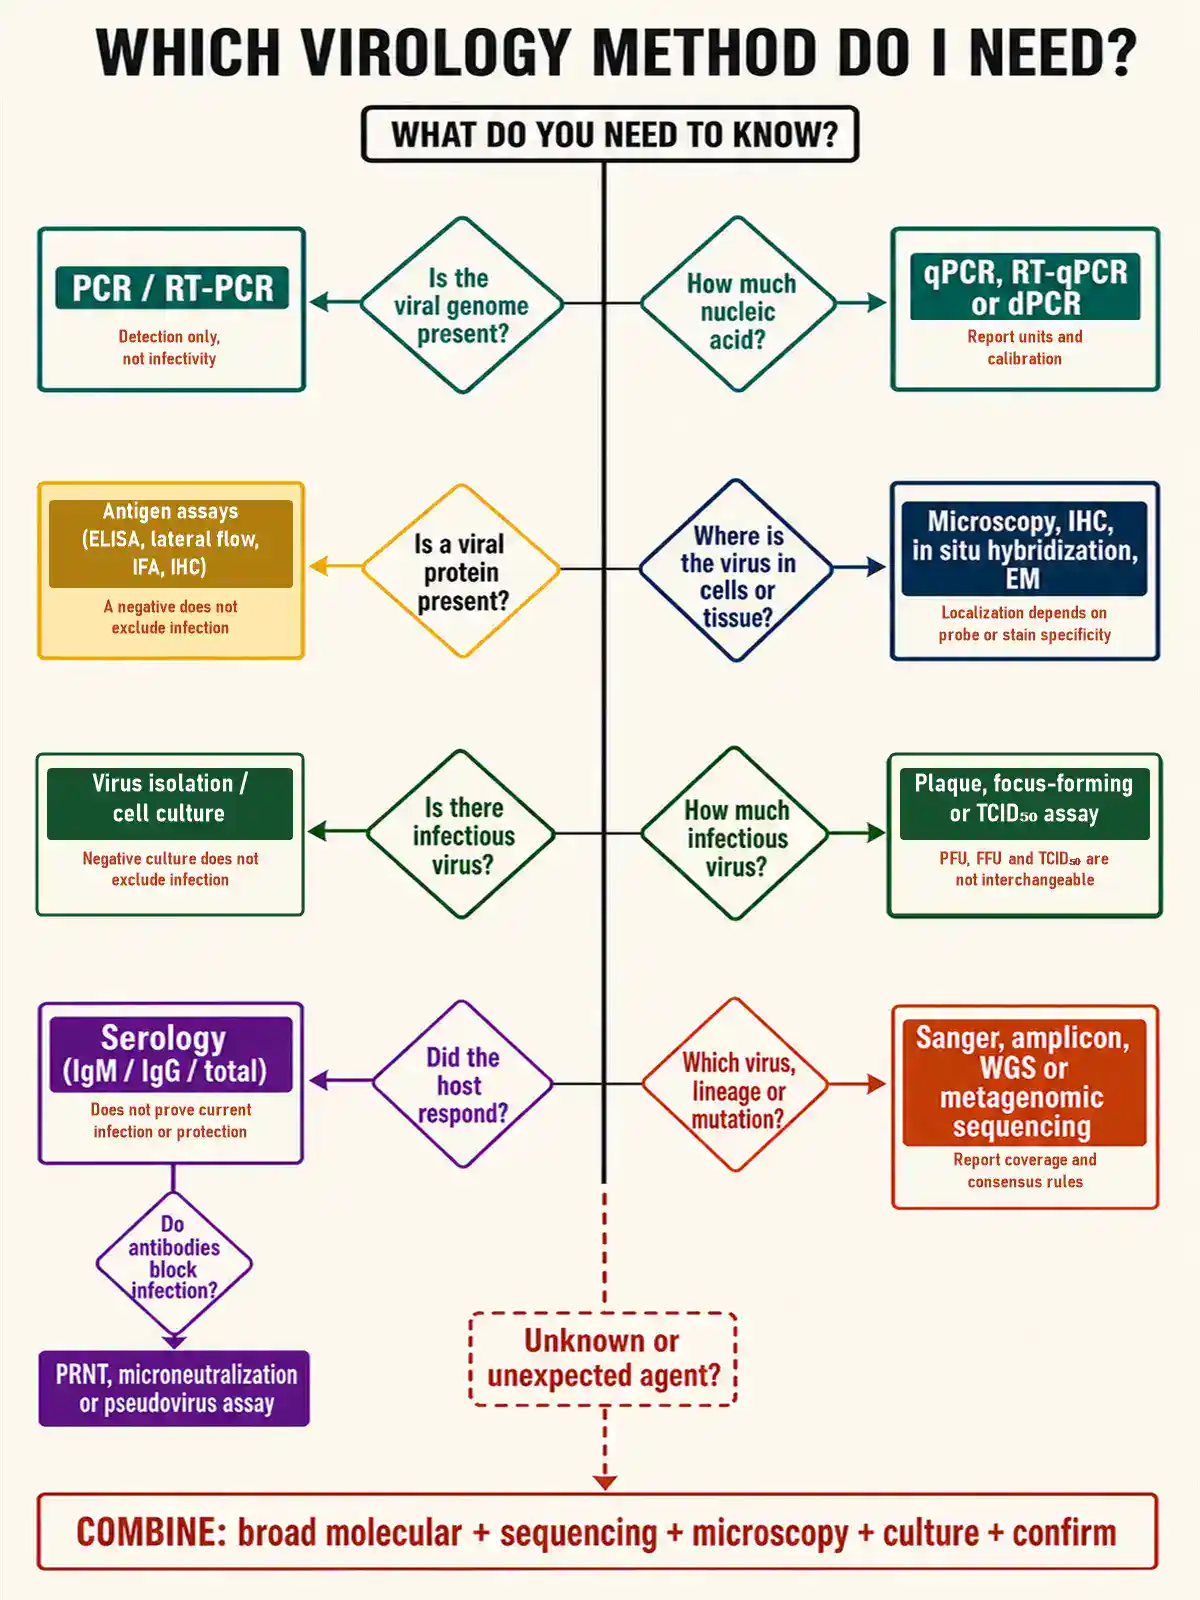
The strongest conclusions often come from orthogonal evidence. For example, PCR can detect a target sequence, sequencing can confirm its identity, culture can demonstrate infectivity, and serology can show that the host mounted an immune response. Each result answers a different question.
Related BioExplorer Methods and Resources
- Biology Methods and Protocols: the main directory for laboratory and biological methods.
- Molecular Biology Protocols: DNA extraction, RNA isolation, PCR, qPCR, cloning, electrophoresis, and sequencing methods.
- Cell Biology Protocols: cell culture, counting, viability, staining, imaging, and cell-based assays.
- Microbiology Protocols: culture, microscopy, plating, colony counting, identification, and antimicrobial methods.
- Virology: viruses, replication, classification, viral diseases, vaccines, and antiviral research.
- Microbiology: microorganisms, microbial methods, disease, ecology, and biotechnology.
- Molecular Biology: DNA, RNA, genes, proteins, and gene expression.
- Bioinformatics and Computational Biology: sequence analysis, biological databases, algorithms, and genomic data.
- Biology Tools and Calculators: free browser-based biology calculators and analytical tools.
- Immunology Protocols: ELISA, immunostaining, antibody handling, and immune-assay methods.
- Microscopy Methods: light, fluorescence, and electron microscopy techniques and sample preparation.
- Biochemistry Protocols: protein, enzyme, and assay methods that underpin antigen and neutralization work.
- Biological Databases: sequence, RNA, and protein databases for reference sequences and accessions.
- Virology Journals: peer-reviewed journals publishing virological methods and research.
Authoritative Virology Standards and References
- CDC and NIH: Biosafety in Microbiological and Biomedical Laboratories, Sixth Edition
- World Health Organization: Laboratory Biosafety Manual, Fourth Edition
- International Committee on Taxonomy of Viruses: Current Taxonomy Browser
- MIQE 2.0: Revised Guidelines for Quantitative Real-Time PCR
- dMIQE2020: Guidelines for Digital PCR Experiments
- WHO: Genomic Sequencing of Viruses for Maximum Public Health Impact
- ATCC Virology Culture Guide
- Methods to Study Viruses
- Laboratory Diagnosis of Viral Infections
- Guidelines for Plaque-Reduction Neutralization Testing
- Review of Viral RNA Load and Infectious-Virus Measurements
Image Credits
- Plaque assay dilution series by Y tambe, CC BY-SA 3.0, via Wikimedia Commons.
- VZV plaques by Dr Graham Beards, CC BY-SA 4.0, via Wikimedia Commons.
- CPE syncytium by Y tambe, CC BY-SA 3.0, via Wikimedia Commons.
- Hemagglutination assay by BiotechMichael, CC BY-SA 4.0, via Wikimedia Commons.
- Influenza A virus, negative stain TEM, CDC Public Health Image Library, public domain, via Wikimedia Commons.
- Mumps virus, negative stained TEM, CDC Public Health Image Library, public domain, via Wikimedia Commons.
- Immunofluorescence (positive) and Immunofluorescence (negative), National Cancer Institute, public domain, via Wikimedia Commons.
- qPCR results, amplification plot and melting curves by Helixitta, CC BY-SA 4.0, via Wikimedia Commons.
- LFT lateral flow test (positive) by Iantresman, CC BY-SA 4.0, via Wikimedia Commons.
- Biosafety Cabinet by Ajay Kumar Chaurasiya, CC BY-SA 4.0, via Wikimedia Commons.
- Microtiter plate by Jeffrey M. Vinocur, CC BY 2.5, via Wikimedia Commons.
- Neurospheres with ZIKV infection by Luiz Carlos de Caires Junior, Ernesto Goulart, Uirá Souto Melo, Bruno Henrique Silva Araujo et al., CC BY 4.0, via Wikimedia Commons.
Frequently Asked Questions
Common virology methods include virus isolation, cell culture, plaque assays, TCID50 assays, antigen testing, serology, neutralization assays, PCR, RT-PCR, qPCR, digital PCR, microscopy, immunostaining, and viral genome sequencing.
PCR detects a selected viral nucleic acid sequence. Virus culture attempts to recover replication-competent virus in a susceptible biological system. PCR can remain positive when infectious virus is no longer recoverable, while culture may be negative because the virus lost infectivity or cannot grow in the chosen system.
Not necessarily. PCR detects viral genetic material, not transmission itself. Infectiousness depends on viable virus, target site, timing, host factors, specimen quality, immune status, behavior, and route of transmission.
A plaque assay measures localized infectious events in susceptible cells. Results are usually reported as plaque-forming units per unit volume. It does not directly count every physical viral particle.
PFU is based on countable plaques. TCID50 is a statistical estimate of the dose that produces a defined infection endpoint in 50% of inoculated cultures. The units depend on different assay designs and should not be treated as universally interchangeable.
RT refers to reverse transcription, which converts RNA into complementary DNA. qPCR measures amplification in real time. An RNA virus may therefore be tested by RT-PCR for qualitative detection or by RT-qPCR for real-time quantitative analysis.
Sometimes, but not in every situation. Antibody interpretation depends on the virus, antibody class, timing, vaccination, previous exposure, immune status, cross-reactivity, and assay design. Direct antigen or nucleic acid detection may be more appropriate during active infection.
There is no single biosafety level for all virology. Required containment depends on the agent or suspected material, procedure, concentration, volume, exposure route, host system, facility, personnel competency, and applicable regulations. A documented, procedure-specific risk assessment must guide the decision.
Controls show whether sample processing, reagents, cells, extraction, amplification, detection, sequencing, and analysis behaved as expected. Without appropriate controls, a negative result may reflect assay failure and a positive result may reflect contamination or nonspecific signal.
Tests may measure different targets or use different extraction volumes, calibrators, instruments, primers, thresholds, units, specimen types, and analytical ranges. Genome copies, infectious units, antigen concentration, and physical-particle counts describe different properties of a sample.
Cite this page
BioExplorer. (2026, August 26). Virology Methods and Protocols. https://www.bioexplorer.net/methods_and_protocols/virology/