
Annexin V/PI Apoptosis Calculator
An Annexin V/PI apoptosis calculator is a flow cytometry interpretation tool that takes the four quadrant percentages or event counts from an Annexin V-FITC / Propidium Iodide (PI) double-stain experiment and returns per-sample viability, early apoptosis, late apoptosis, and necrosis percentages, plus the treatment induction delta.
Enter your control and treated sample quadrant data, and the calculator returns commonly reported outputs: total apoptosis percentage, total cell death percentage, and the percentage-point induction between treated and control.
Annexin V/PI Apoptosis Calculator
Enter the quadrant percentages (or counts) from a flow cytometry Annexin V-FITC / Propidium Iodide (PI) double-stain experiment for your control and treated samples. The calculator returns per-sample quadrant percentages, total apoptosis, total cell death, and the treatment induction delta with interpretation bands.
How to Use the Annexin V/PI Apoptosis Calculator
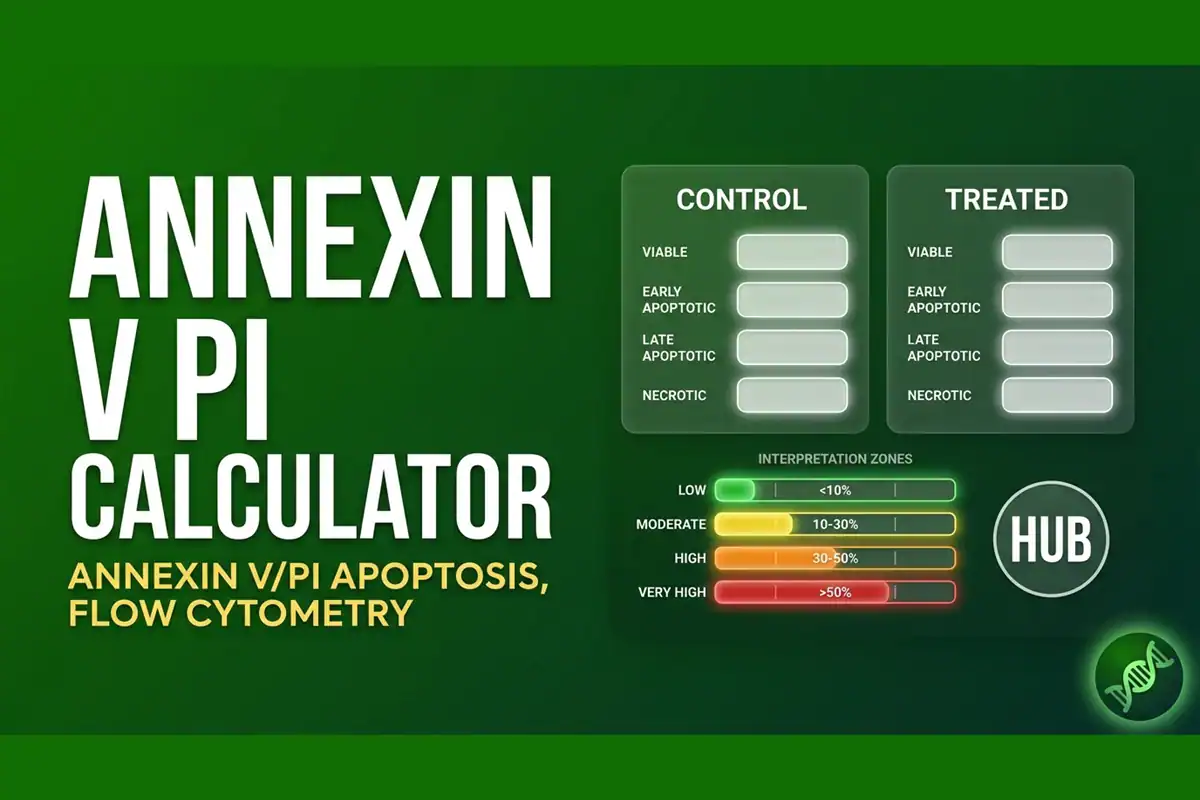
- Run your flow cytometry experiment using Annexin V-FITC and Propidium Iodide (PI) double staining. Collect at least 1,000 events per sample for routine interpretation; 10,000 or more events is a better target for publication-quality datasets.
- Draw your gates in your flow cytometry software (FlowJo, FACSDiva, WinMDI) to separate the four populations: viable, early apoptotic, late apoptotic, and PI-positive dead cells. Export the quadrant percentages or the absolute event counts.
- Enter your control sample data in the left card. Either quadrant percentages (which sum to about 100%) or event counts (which typically sum to thousands) work; the calculator auto-detects which mode you are using.
- Enter your treated sample data in the right card using the same units. The calculator will normalize counts to percentages automatically.
- Read the per-sample stats and zone chart. The six stat cards give you the percentages for each population. The interpretation zone chart shows where your values land on a low / moderate / high / very high teaching scale.
- Read the induction delta at the bottom. The treated minus control percentages summarize treatment effect. The colored delta cards show whether viability loss and apoptosis induction are low, moderate, high, or very high relative to the tool bands.
What Is Annexin V/PI Staining?
Annexin V/PI double staining is a flow cytometry assay that distinguishes viable, early apoptotic, late apoptotic, and necrotic cells in a single sample. Annexin V is a 35 to 36 kDa calcium-dependent phospholipid binding protein that binds phosphatidylserine (PS) with high affinity. Propidium Iodide (PI) is a membrane-impermeable DNA dye that only enters cells with compromised plasma membranes.
The assay works because of two biology events that happen during apoptosis. First, phosphatidylserine normally sits on the inner leaflet of the plasma membrane. Early in apoptosis, PS flips to the outer leaflet, where Annexin V can bind it. Second, the plasma membrane stays intact during early apoptosis but becomes permeable during late apoptosis and necrosis, allowing PI to enter and stain the DNA.
Combining Annexin V and PI in a single stain produces four commonly interpreted populations when analyzed on a flow cytometer. Viable cells exclude both dyes. Early apoptotic cells bind Annexin V but exclude PI. Late apoptotic or secondary necrotic cells usually bind Annexin V and take up PI. The Annexin V-negative / PI-positive quadrant is commonly labeled necrotic or membrane-damaged, but this population should be interpreted with the sample preparation method and time course in mind.

Cell Doubling Time and PDL Calculator
How the Quadrant Assignment Works
Flow cytometry software displays Annexin V fluorescence on one axis and PI fluorescence on the other, producing a two-dimensional dot plot divided into four quadrants. The biological identity of each quadrant is consistent across all flow cytometry software. The Q-number assigned to each quadrant, however, varies by software.
| Position | Annexin V | PI | Identity | Most common Q-number |
|---|---|---|---|---|
| Lower-left | − | − | Viable cells | Q4 (BD) or Q3 (Bio-protocol) |
| Lower-right | + | − | Early apoptotic cells | Q3 (BD) or Q4 (Bio-protocol) |
| Upper-right | + | + | Late apoptotic cells | Q2 (most conventions) |
| Upper-left | − | + | Necrotic cells | Q1 (most conventions) |
The standard formula for total apoptosis is the sum of the early apoptotic and late apoptotic populations. Use the biological labels rather than Q-numbers, because Q-numbering can change between software packages and plot conventions. Total cell death is total apoptosis plus the PI-positive necrotic or membrane-damaged population.
Interpretation Bands
The interpretation bands in this tool are broad teaching bands for typical mammalian cell-culture apoptosis assays. Healthy, well-handled cultures often show low baseline Annexin V/PI positivity, while apoptosis-inducing treatments can shift cells into the Annexin V-positive quadrants over time. Exact thresholds depend on cell line, treatment, harvest method, staining protocol, compensation, and gate placement.
| Anchor experiment | Total apoptosis | Band |
|---|---|---|
| Well-handled untreated culture | Usually low, protocol-dependent | Low (basal) |
| Moderate treatment response | 10 to 25% | Moderate |
| Strong treatment response | 25 to 50% | High |
| Very strong treatment response | Above 50% | Very high |
The tool’s interpretation bands treat values under 10 percent total apoptosis as low, 10 to 25 percent as moderate, 25 to 50 percent as high, and above 50 percent as very high. These thresholds are rough guides for teaching and quick screening, not universal cutoffs. Cell lines with unusually high or low baseline apoptosis, including primary cultures and apoptosis-prone lines, may need adjusted thresholds. The interpretation zone chart visualizes where your sample’s values land on the band scale.
Worked Examples
Example 1: Untreated MCF-7 Control
The built-in untreated MCF-7 worked example uses a low-apoptosis control profile: 95.5 percent viable, 2.1 percent early apoptotic, 1.4 percent late apoptotic, and 1.0 percent PI-positive necrotic or membrane-damaged cells. Total apoptosis is 3.5 percent, and total death is 4.5 percent. The interpretation bands flag every population as low, consistent with a well-handled control sample.
Setup: Control sample, viable 95.5, early 2.1, late 1.4, necrotic 1.0.
Result: Total apoptosis 3.5 percent (low band), total death 4.5 percent (low band), viable 95.5 percent (low stress band). All four quadrants fall in the low band. Treat this as a clean worked-example baseline, not a universal requirement for every mammalian cell line.
Example 2: Camptothecin-Treated MCF-7 (4 hours)
The built-in camptothecin-treated MCF-7 worked example uses a strong treatment-response profile. The viable population drops to 44.7 percent, early apoptotic cells rise to 25.3 percent, late apoptotic cells rise to 8.5 percent, and PI-positive necrotic or membrane-damaged cells rise to 3.6 percent. Total apoptosis is 33.8 percent (high band), and total death is 37.4 percent.
Setup: Treated sample, viable 44.7, early 25.3, late 8.5, necrotic 3.6.
Result: Total apoptosis 33.8 percent (high band), viable 44.7 percent (very high stress band), early apoptotic 25.3 percent (high band), late apoptotic 8.5 percent (moderate band). The drop in viability and rise in Annexin V-positive cells are consistent with a camptothecin response, since camptothecin inhibits topoisomerase I and can trigger apoptosis after DNA damage.
Example 3: Induction Delta (Treated Minus Control)
The induction delta is the treated sample minus the control sample. For the camptothecin worked example above, the delta versus untreated control is: viable minus 50.8 percentage points, early apoptotic plus 23.2 percentage points, late apoptotic plus 7.1 percentage points, and PI-positive necrotic or membrane-damaged cells plus 2.6 percentage points. Total apoptosis induction is plus 30.3 percentage points, and total death induction is plus 32.9 percentage points.
Setup: Load the worked example button. The calculator populates the control sample with the untreated MCF-7 profile and the treated sample with the camptothecin-response profile.
Result: Viability loss is minus 50.8 pp, total apoptosis induction is plus 30.3 pp, and total death induction is plus 32.9 pp. A concise way to report the worked example is: “In this Annexin V/PI example, camptothecin treatment increased total apoptosis by 30.3 percentage points over the untreated MCF-7 control.”
Primary Necrosis Versus Late Apoptosis
A common error when interpreting Annexin V/PI data is conflating late apoptotic cells (Q2, double-positive) with primary necrotic cells (Q1, PI positive only). The distinction matters because the two populations reflect different biological processes.
The Annexin V-negative / PI-positive quadrant is commonly interpreted as primary necrosis or membrane damage. These cells may reflect mechanical damage during sample preparation, freeze-thaw injury, or non-apoptotic cell death. In a well-handled culture, this population is usually expected to be low, but the acceptable baseline depends on the cell type and preparation method.
Late apoptotic or secondary necrotic cells bind Annexin V and take up PI. These cells exposed phosphatidylserine and then lost membrane integrity as a downstream consequence of cell death progression. This population is often biologically meaningful when testing an apoptosis-inducing treatment, especially when it appears with an increase in the early apoptotic population over time.
If you want to distinguish primary necrosis from late apoptosis in your analysis, compare the PI-positive-only population with the double-positive population and interpret that comparison alongside the treatment time course, morphology, and sample handling.
A high PI-positive-only signal can suggest preparation damage or non-apoptotic death, while a strong Annexin V-positive shift is more consistent with apoptosis induction.
Limits of the Annexin V/PI Assay
- Sample size matters: Quadrant percentages from fewer than 1,000 events have large uncertainty, especially for small populations. Collect at least 10,000 events when possible for publication-quality apoptosis data. The tool flags events below 1,000 with a soft warning and below 100 with a hard error.
- Cell line variability: Some lines, including Jurkat and HL-60, can have higher baseline apoptosis than many adherent cell lines. The default bands assume typical mammalian cell-culture samples; unusual baselines may need adjusted interpretation.
- Detachment and digestion artifacts: Adherent cells that are harshly trypsinized or scraped can show artificially high PI-positive populations from mechanical damage. Consider gentler harvest methods such as Accutase or EDTA-based detachment when compatible with your assay. Treat any high PI-positive-only population with skepticism until you have ruled out preparation artifacts.
- Assay context matters: Annexin V/PI interpretation is best established for mammalian cell-culture flow cytometry. Plant protoplasts, microbes, and specialized cell types may have different membrane biology, wall-removal artifacts, or dye-uptake behavior and require protocol-specific validation.
- Time course matters: Apoptosis is a kinetic process. Early time points often show more Annexin V-positive / PI-negative cells. Later time points can shift toward double-positive cells as membrane integrity is lost. The assay captures a single snapshot of the time course.
- No direct quantification of caspase activation: Annexin V/PI measures phosphatidylserine exposure and membrane permeability. It does not directly measure caspase activation. For caspase-specific assays, use a caspase-3/7 substrate or antibody-based caspase assay alongside Annexin V/PI.

Cell Culture Media Preparation Calculator
Related Resources
- Biology Tools Hub. Main directory of all BioExplorer interactive tools, organized by branch of biology.
- Genetics Calculators and Tools. Punnett square, chi-square, Hardy-Weinberg, epistasis, and other genetics tools.
- Botany Calculators and Tools. Specific Leaf Area, Seed Germination, and Farquhar photosynthesis calculators.
- Cell Biology Glossary. Definitions for cell biology terms from apoptosis to zygote.
- Cell Biology Overview. Background on cell structure, division, signaling, and death.
- History of Cell Biology: Explore the entire timeline of cell biology from inception.
Frequently Asked Questions
The viable population is in the lower-left quadrant (Annexin V negative / PI negative). Cells in this quadrant exclude both dyes: they have intact plasma membranes (so PI cannot enter) and have not externalized phosphatidylserine (so Annexin V cannot bind). Viable cells should make up the majority of any healthy cell culture.
Early apoptotic cells are Annexin V positive but PI negative (lower-right quadrant). They have externalized phosphatidylserine but still have intact membranes. Late apoptotic or secondary necrotic cells are Annexin V positive and PI positive (upper-right quadrant). They have externalized PS and lost membrane integrity. The Annexin V-negative / PI-positive quadrant (upper-left) is commonly interpreted as necrotic or membrane-damaged, but it should be read alongside time course, sample handling, and morphology.
The induction delta is the percentage point difference between treated and control samples for each population. It is a common treatment-effect summary: treated minus control. The tool computes six deltas: viable, early apoptotic, late apoptotic, necrotic, total apoptosis, and total death. A delta of plus 30.3 percentage points in total apoptosis means the treatment increased apoptosis by 30.3 percentage points over the untreated control. This helps account for baseline apoptosis in the control sample.
Yes. The tool auto-detects whether your input is percentages or counts. If any field exceeds 100, or if all values are non-negative integers whose sum is not close to 100, the tool treats the input as counts and normalizes to percentages. If the values sum to within 98 to 102 percent, the tool treats them as percentages and uses them directly. The auto-detected mode is shown beneath each sample input as italic gray text. Real flow cytometry exports come in both formats: FlowJo defaults to percentages, but some software exports raw event counts.
The default bands are broad teaching guides for typical mammalian cell-culture samples. Cell lines with unusually high baseline apoptosis, including Jurkat, HL-60, primary cultures, or apoptosis-prone lines, may not fit the default thresholds. For cell-line-specific interpretation, treat the bands as rough guides rather than absolute cutoffs. The tool shows your raw values plus the band label, so you can apply your own cell-line context.
The BioExplorer team reads every email sent through the contact form on this site. Common requests include adding more cell line presets, supporting Annexin V/7-AAD or Annexin V/DAPI dye variants, and adding a Caspase-3/7 positive cell analysis. Send your idea and the team can usually assess feasibility within a few days.
The Annexin V/PI Apoptosis Calculator is part of the BioExplorer suite of free cell biology learning tools. It is designed for cell biology grad students, postdocs, and lab technicians running flow cytometry apoptosis assays, and for course instructors preparing examples.
The calculator implements the standard four-population interpretation: viable, early apoptotic, late apoptotic or secondary necrotic, and PI-positive necrotic or membrane-damaged cells. Total apoptosis is the sum of the early and late apoptotic populations, and total cell death adds the PI-positive necrotic or membrane-damaged population.
The interpretation bands are broad teaching guides for quick screening, not universal cell-line-specific cutoffs. The tool handles both quadrant percentages and raw event counts via auto-detection. Worked examples use a low-apoptosis MCF-7 control profile and a strong camptothecin-response profile to demonstrate the calculation.
References:
Cite this page
BioExplorer. (2026, September 30). Annexin V/PI Apoptosis Calculator. https://www.bioexplorer.net/annexin-v-pi-apoptosis-calculator/