
Photobiology Methods and Protocols
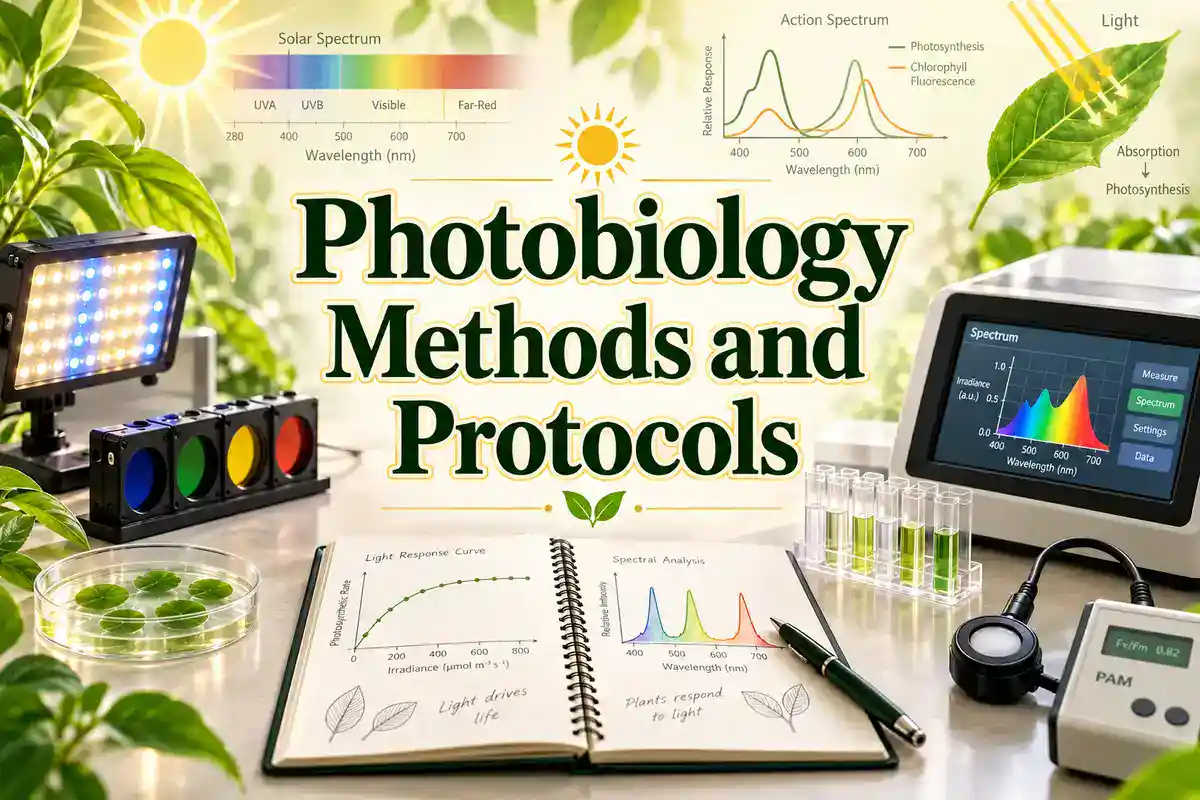
Photobiology examines what happens when light interacts with living systems. That sounds simple until you try to run a reproducible experiment. A biological response may depend on wavelength, spectral bandwidth, irradiance, exposure time, total radiant exposure, temperature, geometry, tissue depth, photosensitizers, repair processes, and the physiological state of the organism.
That is why a good photobiology protocol records much more than "samples were exposed to light". The light source has to be characterized at the sample plane, the biological endpoint has to be matched to the relevant wavelengths, and the controls have to separate a true photobiological effect from heat, handling, background illumination, toxicity, or instrument drift.
This guide explains the practical principles behind photobiology methods, including spectroradiometry, action spectra, ultraviolet radiation experiments, chlorophyll fluorescence, photosynthesis measurements, phototoxicity assays, photodynamic therapy research, fluorescence-based methods, and light-response experiments.
It is written as a methods hub rather than a single bench recipe because the correct protocol depends heavily on the organism, tissue, wavelength range, and biological question.
Ultraviolet sources, intense visible-light sources, lasers, and high-power LEDs can injure the eyes or skin. Use an institution-approved risk assessment, appropriate shielding, interlocks where required, protective equipment, and source-specific operating procedures. Do not assume that a source is harmless because the beam is invisible or does not feel hot.
Photobiology Methods and Protocols Guide:
- What Does Photobiology Measure?
- The Core Quantities in a Photobiology Experiment
- Why Wavelength Matters: Action Spectra
- Characterizing Light Sources with Spectroradiometry
- Choosing Between Radiometric and Photon-Based Measurements
- Ultraviolet Photobiology Methods
- Photosynthesis and Chlorophyll Fluorescence Methods
- Absorption and Fluorescence Spectroscopy in Photobiology
- Phototoxicity and Photosafety Testing
- Photodynamic Therapy Research Methods
- Light-Controlled Growth, Development, and Behavior
- How to Design a Reproducible Photobiology Experiment
- Controls That Matter in Photobiology
- Common Photobiology Errors
- Photobiology Troubleshooting Guide
- Minimum Reporting Checklist for Photobiology Studies
- Photobiology Safety: UV, Lasers, and High-Intensity Sources
- Related BioExplorer Methods and Resources
- Authoritative References for Photobiology Methods
- Frequently Asked Questions
What Does Photobiology Measure?
Photobiology is not one assay. It is a collection of experimental approaches that connect an optical exposure to a biological response. The first question should therefore be: What exactly am I trying to measure?
| Question | Typical method | What the result tells you |
|---|---|---|
| Which wavelengths produce a biological effect? | Action-spectrum experiment | Relative effectiveness of wavelength for a defined response |
| How much optical radiation reaches the sample? | Radiometer or spectroradiometer | Irradiance, spectral irradiance, radiant exposure, or photon irradiance |
| How strongly does a molecule absorb light? | UV-visible spectrophotometry | Absorbance or transmittance as a function of wavelength |
| Does a fluorophore or pigment emit light after excitation? | Fluorometry or fluorescence spectroscopy | Excitation and emission characteristics |
| How efficiently is photosystem II operating? | Chlorophyll fluorescence, often PAM fluorometry | Photochemical and non-photochemical fluorescence parameters |
| Does ultraviolet radiation damage DNA? | Photoproduct assays, immunochemical methods, chromatography, or molecular assays | Formation and repair of UV-induced DNA lesions |
| Does light make a chemical more toxic? | Phototoxicity assay with light and dark controls | Difference in biological toxicity with versus without irradiation |
| Does a photosensitizer produce a therapeutic effect after illumination? | Photodynamic therapy research assays | Light-dependent biological activity of a photosensitizer system |
| How does light regulate growth, movement, development, or timing? | Controlled wavelength and dose-response experiments | Physiological or behavioral response to defined optical stimuli |
The central principle is simple: light exposure has to be treated as a measured experimental variable, not merely as a treatment label.
The Core Quantities in a Photobiology Experiment
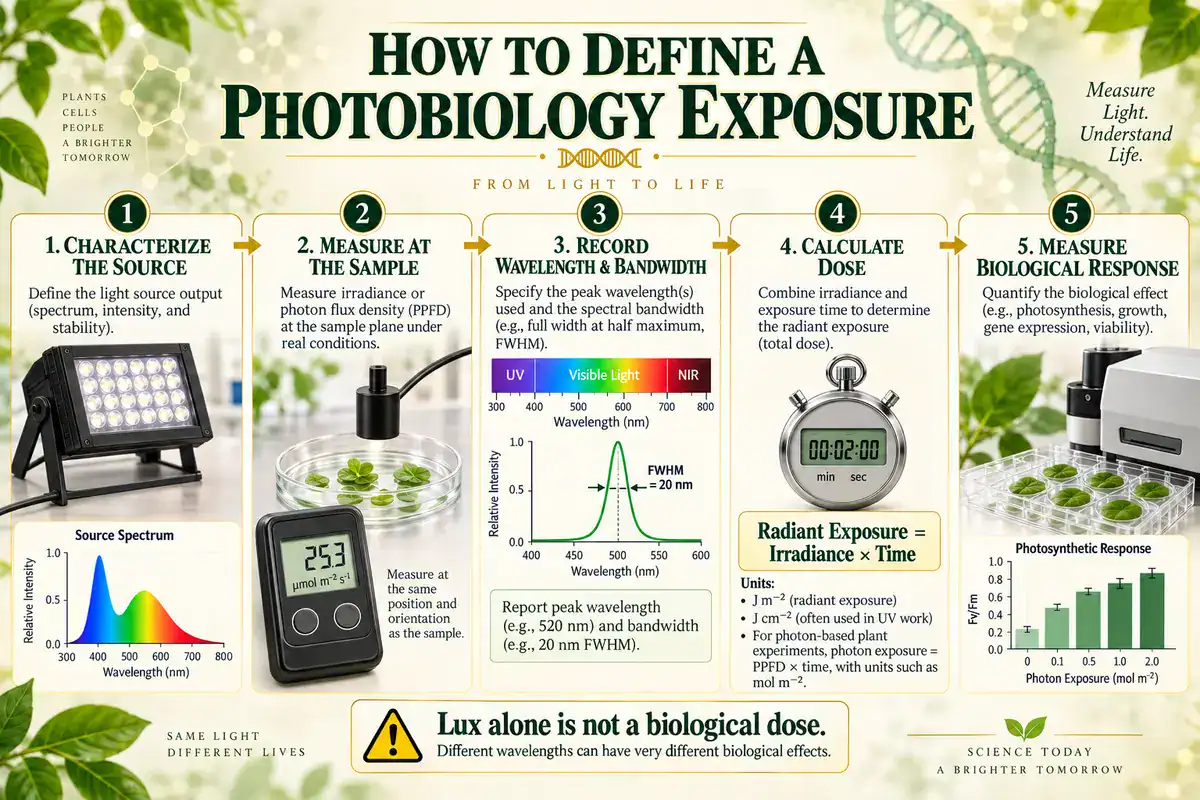
Many photobiology experiments become difficult to reproduce because authors report only lamp type or exposure time. Neither tells another laboratory how much radiation reached the specimen.
| Quantity | Common unit | Meaning |
|---|---|---|
| Irradiance | W/m² | Radiant power incident on a surface per unit area |
| Spectral irradiance | W/m²/nm | Irradiance resolved by wavelength |
| Radiant exposure | J/m² | Radiant energy incident on a surface per unit area over an exposure period |
| Photon irradiance | photons/m²/s or mol photons/m²/s | Number of incident photons per unit area per unit time |
| Photon exposure | photons/m² or mol photons/m² | Total incident photons per unit area over time |
| Wavelength | nm | Spectral location of the radiation |
| Bandwidth | nm | Width of the wavelength band emitted or selected |
| Illuminance | lux | Visible light weighted for human visual sensitivity, not a general measure of biological dose |
The International Commission on Illumination (CIE) defines radiant exposure as radiant energy per unit area and expresses it in joules per square metre. The CIE also distinguishes radiometric quantities from photometric quantities such as lux, which are weighted for human vision.
For a constant irradiance over time, radiant exposure can be calculated as:
Radiant exposure = irradiance × exposure time
For example, an irradiance of 5 W/m² delivered for 60 seconds gives a radiant exposure of 300 J/m². This calculation is valid only when the irradiance is adequately represented by the stated value over the exposure period.
Do not assume that two exposures with the same total radiant exposure will always produce the same biological effect. Reciprocity can fail when repair, adaptation, saturation, photobleaching, oxygen depletion, signaling kinetics, or other time-dependent biological processes matter.
Why Wavelength Matters: Action Spectra
A biological system rarely responds equally to every wavelength. DNA, chlorophylls, flavins, opsins, porphyrins, phytochromes, cryptochromes, and other chromophores absorb different parts of the spectrum. The biological response therefore depends on both the spectrum of the source and the spectral sensitivity of the biological target.
The CIE defines an action spectrum as a function representing the relative spectral effectiveness of optical radiation for a specified biological effect in a specified system. In practical terms, an action spectrum asks: which wavelengths are most effective at producing this particular response?
That definition contains two important limitations. First, an action spectrum belongs to a specific response. The action spectrum for erythema is not automatically the action spectrum for DNA damage, photosynthesis, circadian response, or phototoxicity. Second, an action spectrum depends on the biological system being studied.
A Practical Action-Spectrum Workflow
- Define one measurable endpoint. Examples include enzyme activity, seedling elongation, chlorophyll fluorescence, DNA photoproduct formation, gene expression, or cell viability.
- Select a set of wavelengths. Use monochromatic or narrow-band radiation whenever possible if wavelength dependence is the central question.
- Measure the actual spectrum at the sample plane. Nominal LED wavelength is not enough.
- Normalize exposure appropriately. Depending on the question, this may involve equal radiant exposure, equal photon exposure, or another justified basis.
- Include dark and sham controls. Keep handling identical except for the optical exposure.
- Measure a dose-response at each wavelength. A single dose can hide differences in sensitivity or saturation.
- Plot relative effectiveness against wavelength. State clearly how the response was normalized.
Broadband lamps and LEDs can have overlapping emission bands, so a source labeled "450 nm" may still deliver biologically relevant radiation outside 450 nm. A published method for correcting action spectra emphasizes that the actual emission spectrum of the irradiation source can affect the apparent wavelength-response relationship. See the open-access methods paper in MethodsX.
Characterizing Light Sources with Spectroradiometry
A spectroradiometer measures optical radiation as a function of wavelength. For photobiology, it is one of the most useful tools for checking what a lamp, LED array, solar simulator, monochromator, or filtered source is actually delivering.
Measure the spectrum where the biological sample sits, with the detector oriented as the sample is oriented. Distance, angle, diffuser material, culture-vessel lids, filters, water depth, plasticware, glass, and reflections can all change the spectrum or the irradiance that reaches the specimen.
Record These Source Details
- Light-source type and model
- Nominal wavelength or spectral range
- Measured spectral power distribution
- Peak or centroid wavelength when appropriate
- Bandwidth or full width at half maximum for narrow-band sources
- Irradiance or photon irradiance at the sample plane
- Distance from source to sample
- Beam or field geometry
- Uniformity across the exposure area
- Filters, diffusers, optics, lids, or vessel materials in the optical path
- Warm-up time and source stability
- Detector type, calibration status, and calibration date
- Ambient or stray-light conditions
- Sample temperature during exposure
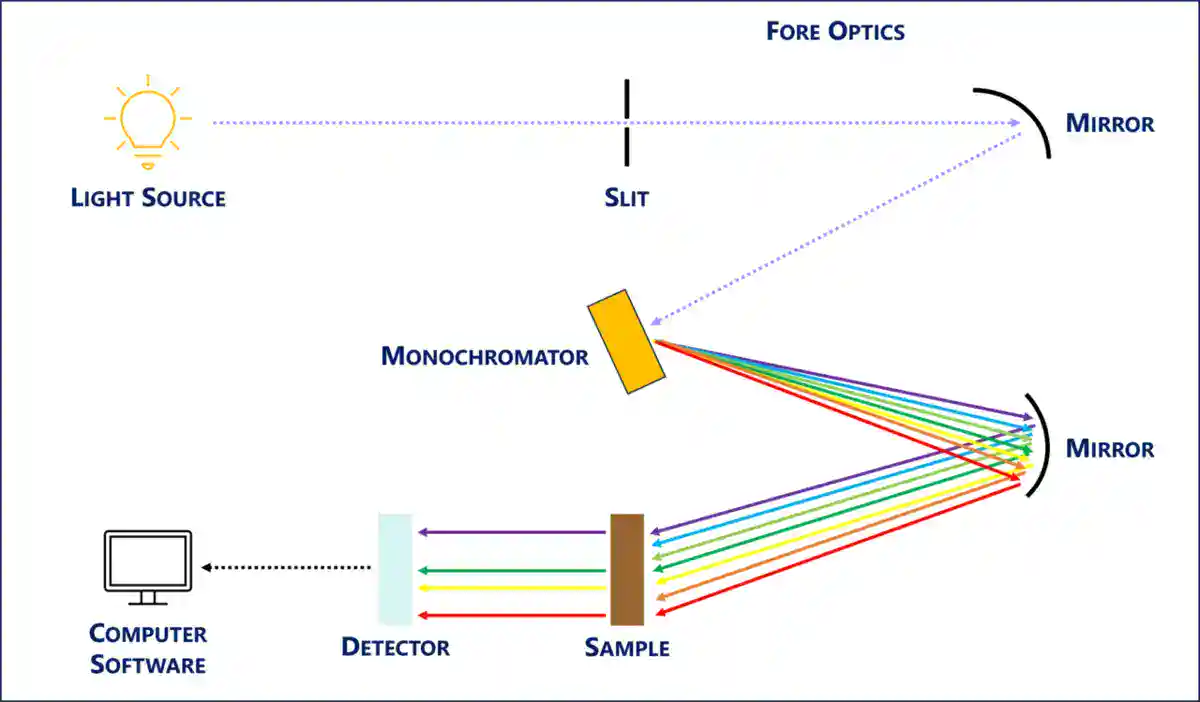
The practical lesson is important: do not report only the manufacturer's nominal wavelength. Biological effects are produced by the radiation that reaches the specimen, not by the label printed on the lamp.
Choosing Between Radiometric and Photon-Based Measurements
Radiometric measurements describe energy. Photon-based measurements describe photon number. Both can be legitimate, but they answer slightly different questions.
A photon at a shorter wavelength carries more energy than a photon at a longer wavelength. Equal watts at two different wavelengths therefore do not represent equal numbers of photons. For photochemical and photosynthetic experiments, where individual photon absorption events matter, photon irradiance can be especially useful. Plant scientists commonly report photosynthetic photon flux density in micromoles of photons per square metre per second.
For UV hazard, tissue exposure, and many photomedicine applications, radiometric quantities such as W/m² and J/cm² or J/m² are common. Whatever quantity you choose, state it clearly and do not switch between energy-based and photon-based units without an explicit conversion.
Ultraviolet Photobiology Methods
Ultraviolet photobiology studies how UV radiation affects molecules, cells, tissues, organisms, and ecosystems. Common endpoints include DNA photoproducts, oxidative stress, erythema, pigmentation, immune responses, cell survival, microbial inactivation, plant growth, and repair.
UV bands are commonly divided into UVA, UVB, and UVC. The exact boundaries depend on the convention being used, so a rigorous methods section should report the wavelength range rather than relying only on a band name. For biological work, the measured source spectrum matters more than the shorthand label.
The World Health Organization notes that UVA and UVB differ in penetration and biological effects. UVB is absorbed more strongly in the epidermis, while UVA penetrates more deeply into skin. Both can contribute to biological damage.
Measuring UV-Induced DNA Damage
DNA is an important UV target. UVB can directly generate lesions such as cyclobutane pyrimidine dimers and 6-4 photoproducts, while UVA can also produce oxidative DNA damage through photosensitized pathways. Reviews of human skin photobiology describe these mechanisms and the assays used to measure them.
Common research approaches include:
- Antibody-based detection of cyclobutane pyrimidine dimers
- Detection of 6-4 photoproducts
- Immunofluorescence imaging of DNA damage markers
- Chromatographic measurement of oxidized nucleosides
- Comet assays for DNA strand damage when appropriate to the research question
- Mutation assays and sequencing for downstream genetic consequences
- Time-course experiments to measure repair kinetics
A classic human-skin action-spectrum study measured wavelength dependence of pyrimidine dimer formation directly in skin, illustrating why DNA damage cannot be predicted from total UV exposure alone. See the primary research record in PubMed.
Controls for UV Experiments
- Dark control: receives identical handling without UV exposure.
- Sham control: placed in the exposure apparatus without active irradiation.
- Thermal control: helps distinguish photobiological effects from heating.
- Positive biological control: confirms that the endpoint assay can detect the expected response.
- Filter control: useful when filters alter wavelength composition.
- Dose-response series: helps distinguish threshold, linear, saturating, and toxic responses.
- Recovery time course: separates immediate damage from repair or delayed signaling.
Photosynthesis and Chlorophyll Fluorescence Methods
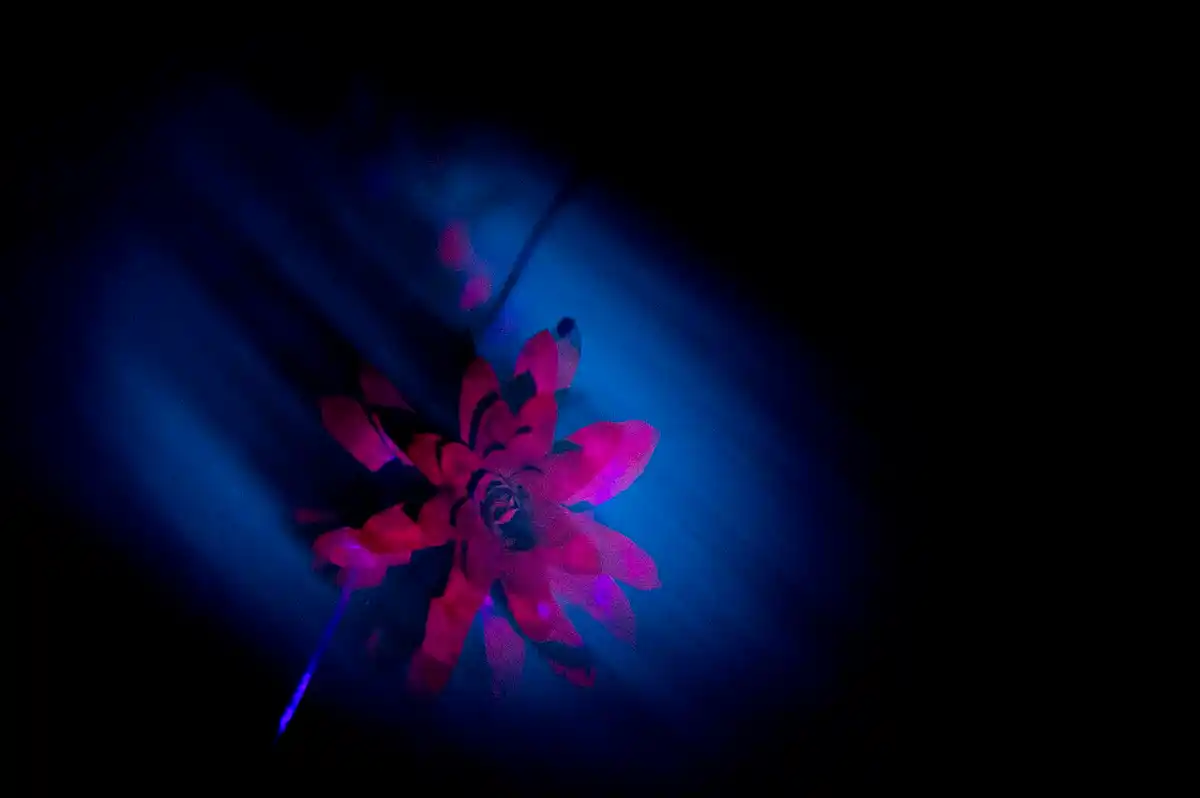
One of the most widely used branches of plant photobiology is chlorophyll fluorescence. Chlorophyll molecules absorb light and can release part of that energy as fluorescence. Changes in fluorescence provide information about how absorbed energy is being used or dissipated in photosynthetic tissues.
Pulse-amplitude-modulated fluorometry, usually called PAM fluorometry, allows researchers to separate measuring light from ambient or actinic light and estimate several photosynthetic parameters. Reviews in Photosynthesis Research and Photosynthesis Research discuss both the power and the limitations of chlorophyll fluorescence measurements.
Common Chlorophyll Fluorescence Parameters
| Parameter | Typical meaning | Important caution |
|---|---|---|
| F0 | Minimum fluorescence of a dark-adapted sample under defined measuring conditions | Depends on instrumentation and adaptation state |
| Fm | Maximum fluorescence of a dark-adapted sample after a saturating pulse | The pulse must actually be saturating for the sample |
| Fv/Fm | (Fm − F0)/Fm; maximum quantum efficiency of PSII photochemistry under the defined dark-adapted condition | Not a universal measure of total photosynthesis |
| ΦPSII or Y(II) | (Fm‘ − Fs)/Fm‘; operational efficiency of PSII photochemistry in a light-adapted state | Interpretation depends on the biological system and measurement assumptions |
| NPQ | (Fm − Fm‘)/Fm‘; non-photochemical quenching index | Represents multiple energy-dissipation processes rather than a single pathway |
Fluorescence-derived parameters are highly useful, but they should not be treated as direct measurements of carbon fixation. Gas exchange, oxygen evolution, pigment analysis, biochemical assays, and other measurements can provide complementary evidence.
Practical Chlorophyll Fluorescence Checklist
- State species, tissue, age, growth conditions, and stress treatment.
- Report whether the sample was dark-adapted or light-adapted and for how long.
- Record measuring-light, actinic-light, and saturating-pulse settings.
- Report the wavelength or spectrum of the light source.
- Measure photon irradiance at the sample.
- Keep leaf orientation and measurement geometry consistent.
- Control sample temperature.
- Use the same instrument settings across treatments unless there is a justified reason not to.
- Inspect raw traces, not only calculated summary parameters.
- Do not transfer higher-plant assumptions automatically to algae or cyanobacteria.
Cyanobacteria are a good example of why that last point matters. Their phycobiliproteins, state transitions, and overlapping respiratory and photosynthetic electron transport can complicate fluorescence interpretation. A detailed review is available through PubMed Central.
Absorption and Fluorescence Spectroscopy in Photobiology
Before exposing a biological system, it is often useful to know what the relevant pigment, photosensitizer, protein, or chromophore absorbs. UV-visible absorption spectroscopy measures how much light a sample absorbs across wavelength. Fluorescence spectroscopy measures light emitted after excitation.
These spectra can help researchers choose excitation wavelengths and distinguish direct absorption from indirect photosensitization.
Absorption Measurements: What to Record
- Sample concentration
- Solvent or buffer
- Optical path length
- Cuvette material
- Blank or reference solution
- Wavelength range
- Spectral bandwidth
- Instrument model
- Baseline correction method
- Temperature if it affects the sample
- Whether scattering contributes to apparent absorbance
Fluorescence Measurements: What to Record
- Excitation wavelength and bandwidth
- Emission scan range and bandwidth
- Detector settings
- Optical geometry
- Background subtraction
- Sample absorbance at the excitation wavelength
- Photobleaching precautions
- Inner-filter corrections when needed
- Reference standard or instrument-response correction where appropriate
A bright fluorescence signal does not automatically mean that a fluorophore is abundant. Fluorescence intensity can change with concentration, quenching, pH, temperature, oxygen, binding state, detector sensitivity, optical alignment, and reabsorption.
Phototoxicity and Photosafety Testing
Phototoxicity occurs when exposure to light changes the toxic effect of a substance. The critical comparison is therefore between matched samples exposed to the test substance with light and without light.
The OECD Test Guideline 432 describes an in vitro 3T3 neutral red uptake phototoxicity test in which cytotoxicity after chemical exposure is compared in irradiated and non-irradiated cells. In 2026, the OECD also published Test Guideline 498 for reconstructed human epidermis phototoxicity testing after topical application.
Key Phototoxicity Controls
- Untreated dark control
- Untreated light control
- Test substance without irradiation
- Test substance with irradiation
- Vehicle control
- Appropriate positive control
- Cell or tissue viability control
- Temperature monitoring during irradiation
That design separates ordinary chemical toxicity from toxicity that requires optical activation. It also makes clear why reporting the source spectrum and dose is essential: a substance can appear non-phototoxic under a source that does not overlap its absorption spectrum.
Photodynamic Therapy Research Methods
Photodynamic therapy, or PDT, combines a photosensitizing agent with light of a suitable wavelength. In the presence of molecular oxygen, photoactivated sensitizers can generate reactive oxygen species, including singlet oxygen, that produce local biological effects. The U.S. National Cancer Institute provides an overview of PDT and its clinical uses.
A strong PDT experiment does not report only "cells were illuminated." Researchers should characterize:
- Photosensitizer identity and formulation
- Concentration
- Incubation period
- Wash or medium-exchange procedure
- Light wavelength and spectrum
- Irradiance
- Radiant exposure
- Exposure geometry
- Sample temperature
- Oxygenation conditions when relevant
- Time between irradiation and biological endpoint
- Dark toxicity
- Light-only toxicity
PDT is especially sensitive to experimental context because the photosensitizer, wavelength, oxygen availability, subcellular localization, irradiance, and total exposure can all affect the outcome. Recent reviews discuss these variables in detail, including a 2025 overview indexed in PubMed.
Light-Controlled Growth, Development, and Behavior
Photobiology extends far beyond UV damage and photosynthesis. Organisms use light as information. Plants sense red, far-red, blue, and UV wavelengths through specialized photoreceptors. Animals use retinal and non-visual photoreception to regulate vision, behavior, and biological timing. Microorganisms can alter movement, metabolism, or gene expression in response to light.
Experiments in these systems should distinguish at least four variables:
- Spectrum: which wavelengths are present?
- Intensity: how much radiation or photon flux reaches the organism?
- Duration: how long is each exposure?
- Timing: when does exposure occur relative to development or the biological cycle?
For timing experiments, the same light delivered at two different biological times can produce different responses. A protocol should therefore report clock time, light-dark schedule, prior adaptation, and the timing of measurements relative to the light stimulus.
How to Design a Reproducible Photobiology Experiment
A reproducible photobiology experiment can usually be organized into the following sequence.
- Define the biological endpoint. Decide what response will be measured and when.
- Identify the relevant spectral region. Base this on known chromophores, prior evidence, or an exploratory action-spectrum design.
- Select and characterize the source. Measure the spectrum at the sample plane.
- Choose the exposure quantity. Decide whether irradiance, radiant exposure, photon irradiance, photon exposure, or a spectrally weighted quantity is appropriate.
- Map field uniformity. Make sure different samples do not receive unintentionally different doses because of position.
- Control temperature. High-power sources can heat the air, medium, culture plate, leaf, or tissue.
- Define dark and light controls. Include all controls needed to isolate the photobiological effect.
- Randomize sample position. This reduces positional bias when the field is not perfectly uniform.
- Measure dose-response rather than one dose when possible. Biological responses can be nonlinear.
- Record timing precisely. Include pre-exposure adaptation and post-exposure recovery.
- Preserve raw optical and biological data. Do not retain only processed values.
- Report enough detail for another laboratory to reconstruct the exposure.
Controls That Matter in Photobiology
| Control | What it helps rule out |
|---|---|
| Dark control | Changes caused by handling, incubation, or time rather than light |
| Sham exposure | Effects of the apparatus or manipulation itself |
| Light-only control | Effects of irradiation without a test compound or photosensitizer |
| Compound-only control | Dark toxicity or biological activity independent of light |
| Thermal control | Heating caused by the source |
| Positive biological control | Failure of the endpoint assay |
| Spectral control | Whether the response is wavelength-specific |
| Dose-response series | Thresholds, saturation, hormesis, or overt toxicity |
| Recovery time course | Repair, adaptation, delayed signaling, or delayed cell death |
Common Photobiology Errors
1. Reporting Lux Instead of a Biological Exposure
Lux is weighted for human visual sensitivity. It can be appropriate for questions involving visual illumination, but it is usually not enough for UV photobiology, plant photosynthesis, photochemistry, or PDT. Two sources with the same lux value can have very different spectra and therefore very different biological effects.
2. Trusting the Lamp Label
An LED described as "365 nm" or "450 nm" still has a finite emission bandwidth. Filters leak. Lamps age. Optical components alter transmission. Measure the source.
3. Ignoring Sample Geometry
A detector placed beside a culture dish does not necessarily measure the dose received through the dish lid, medium, or tissue. Measure in a geometry that represents the actual specimen exposure.
4. Confusing Irradiance with Radiant Exposure
Irradiance describes the rate of delivery. Radiant exposure includes time. Reporting 10 W/m² without the exposure duration does not define the total energy delivered.
5. Assuming Equal Dose Means Equal Biology
Biological systems can respond differently to the same total dose delivered quickly or slowly. Test dose-rate effects when they are biologically plausible.
6. Forgetting Heat
High-power lamps and LEDs can warm samples. A temperature difference between exposed and control groups can mimic or modify a true light response.
7. Using One Biological Endpoint
A decline in fluorescence, viability, growth, or gene expression may have several causes. Orthogonal measurements strengthen the interpretation.
Photobiology Troubleshooting Guide
| Problem | What to check |
|---|---|
| Replicates vary by plate position | Map irradiance uniformity, rotate or randomize positions, and check edge-temperature effects. |
| Expected wavelength response is missing | Verify source spectrum, filter transmission, detector calibration, dose normalization, and biological sensitivity. |
| Light-treated controls lose viability | Check whether the exposure itself is excessive, whether the sample overheats, and whether the medium contains photosensitizing components. |
| Dark controls also respond | Test compound toxicity, handling effects, ambient light exposure, solvent effects, and time-dependent changes. |
| Results drift over weeks | Recheck source output, lamp aging, LED driver stability, instrument calibration, and biological material. |
| Fluorescence signal falls during measurement | Investigate photobleaching, quenching, detector saturation, sample movement, or physiological changes. |
| PAM values are inconsistent | Standardize adaptation time, leaf position, saturation-pulse strength, actinic light, temperature, and instrument settings. |
| Broadband source gives unexpected effects | Inspect the full spectral power distribution, including UV or near-infrared leakage and filter transmission. |
Minimum Reporting Checklist for Photobiology Studies
If another laboratory cannot reconstruct the optical exposure, the experiment is difficult to reproduce. At minimum, report:
- Biological material and preparation
- Light-source make, model, and type
- Measured spectrum
- Wavelength or spectral range
- Bandwidth for narrow-band sources
- Irradiance or photon irradiance at the sample
- Total exposure time
- Radiant exposure or photon exposure
- Distance and geometry
- Exposure-area uniformity
- Filters, diffusers, vessel materials, or optics
- Sample temperature
- Dark, sham, and light-only controls as appropriate
- Pre-exposure adaptation
- Post-exposure recovery time
- Biological endpoint and assay method
- Instrument calibration information
- Replicate structure and statistical analysis
- Any deviations from the planned protocol
For action-spectrum work, also report the actual spectral distribution of each source. For phototoxicity, report both light and dark concentration-response data. For photosynthesis work, report the adaptation state and fluorescence protocol. For PDT, report photosensitizer conditions as well as the optical exposure.
Photobiology Safety: UV, Lasers, and High-Intensity Sources
Optical-radiation hazards depend on wavelength, source intensity, exposure duration, beam geometry, and the tissue at risk. UV can injure the skin and eyes. Blue-rich intense sources can present retinal hazards. Infrared sources can heat tissue, sometimes without producing a bright visual warning. Lasers create additional risks because their beams can remain highly concentrated.
Good laboratory practice includes:
- Enclose the source whenever practical.
- Use source-specific shielding.
- Prevent direct viewing of intense UV or laser radiation.
- Use protective eyewear matched to the wavelength and hazard.
- Cover exposed skin when required by the risk assessment.
- Use interlocks for hazardous enclosed systems where appropriate.
- Label active exposure areas.
- Measure stray radiation if there is uncertainty.
- Train users before they operate high-intensity optical equipment.
- Follow institutional laser and optical-radiation safety procedures.
The WHO ultraviolet-radiation fact sheet summarizes the established health risks of excessive UV exposure.
Related BioExplorer Methods and Resources
- Biology Methods and Protocols: the main BioExplorer laboratory-methods hub.
- Photobiology: the biology of light interactions with organisms.
- Botany: plant biology, including photosynthesis, growth, and environmental responses.
- Cell Biology: cellular methods and biological responses.
- Molecular Biology: DNA, RNA, proteins, gene expression, and molecular assays.
- Molecular Biology Methods and Protocols: PCR, nucleic acids, electrophoresis, sequencing, and related methods.
- Biology Tools and Calculators: browser-based biology calculators and analytical tools.
Authoritative References for Photobiology Methods
- CIE International Lighting Vocabulary: Action Spectrum
- CIE International Lighting Vocabulary: Radiant Exposure
- CIE Technical Note: Relating Photochemical and Photobiological Quantities to Photometric Quantities
- World Health Organization: Ultraviolet Radiation
- World Health Organization: Known Health Effects of Ultraviolet Radiation
- Chlorophyll Fluorometry in Evaluating Photosynthetic Performance
- Frequently Asked Questions About In Vivo Chlorophyll Fluorescence
- Method for Correction of Experimental Action Spectrum Using Actual Overlapping Spectra of Radiation Sources
- Skin DNA Photodamage and Its Biological Consequences
- OECD Test No. 432: In Vitro 3T3 NRU Phototoxicity Test
- OECD Test No. 498: Reconstructed Human Epidermis Phototoxicity Test
- National Cancer Institute: Photodynamic Therapy
Frequently Asked Questions
Photobiology is the study of interactions between optical radiation and living systems. It includes photosynthesis, UV effects, photoreception, biological rhythms, fluorescence, phototoxicity, photoprotection, and light-based therapies.
An action spectrum shows how effective different wavelengths are at producing a defined biological effect in a defined system. It is not the same as an absorption spectrum, although absorption by the relevant chromophore can help shape the biological response.
Irradiance is radiant power received per unit area, usually expressed in W/m². Radiant exposure is the accumulated radiant energy per unit area over time, usually expressed in J/m².
Sometimes, but lux is weighted for human visual sensitivity and is not a general measure of biological optical dose. UV, photosynthesis, photochemistry, and many photomedicine experiments usually require radiometric, spectral, photon-based, or biologically weighted measurements.
The sample may receive a different spectrum and intensity from what the source specification suggests. Distance, angle, filters, diffusers, plastic lids, glass, water, tissue, and source aging can all alter exposure.
Pulse-amplitude-modulated fluorometry is a chlorophyll fluorescence method widely used to study photosynthetic function. It uses modulated measuring light together with actinic illumination and saturating pulses to derive fluorescence parameters associated with photochemical and non-photochemical energy use.
Phototoxicity testing determines whether light increases the harmful effect of a chemical or material. Proper experiments compare matched light-exposed and non-irradiated groups so ordinary toxicity can be separated from light-dependent toxicity.
Report the biological material, source type, measured spectrum, wavelength, bandwidth, irradiance or photon irradiance, total exposure, distance, geometry, field uniformity, temperature, adaptation period, controls, endpoint timing, and calibration details needed to reconstruct the experiment.
Cite this page
BioExplorer. (2026, September 7). Photobiology Methods and Protocols. https://www.bioexplorer.net/methods_and_protocols/photobiology/