
Cell Doubling Time and PDL Calculator
A cell doubling time calculator computes how long a cell population takes to double in number, given two cell counts measured at known timepoints. The same calculator also returns the specific growth rate, the fold change, and the number of population doublings in the interval.
The companion population doubling level (PDL) calculator tracks cumulative doublings across multiple passages, flags finite primary cultures approaching a senescence reference point, and warns when stem cell cultures reach practical monitoring thresholds.
Cell Doubling Time and PDL Calculator
| Time | Cell count | Action |
|---|
| Passage | Days | Cells seeded | Cells harvested | Split (1:N) | Action |
|---|
How to use the cell doubling time calculator
- Select a cell line preset from the dropdown at the top of the calculator. The preset pre-loads a typical doubling time and (for finite cell types) the Hayflick or pluripotency limit.
- Choose the Doubling time tab for 2-point or batch log-phase analysis, or the Population doubling tab for PDL tracking across one or more passages.
- Enter your cell count data. For the 2-point mode, supply the starting count (N1), the ending count (N2), and the two timepoints (t1, t2). For the batch mode, add a row for each log-phase timepoint. For the PDL tab, supply cells seeded and cells harvested for each passage.
- Use the Load example buttons to populate the calculator with worked-example data, then compare the outputs to your own measurements.
- Read the result cards, the interpretation zone chart (for doubling time), and any warnings about fold-change limits, lag-phase contamination, or poor log-linear fit.
Background: how cell populations grow in culture
Most mammalian cell cultures follow a four-phase growth curve after seeding: lag phase (cells adapt to the new vessel, no net division), log phase (exponential growth at a constant rate, also called exponential phase), stationary phase (growth slows due to contact inhibition, nutrient depletion, or waste accumulation), and death phase (viability drops, cell count declines). The doubling time calculation applies to log phase only; lag, stationary, and death phase data give misleading or meaningless results.
The exponential growth model that underlies the doubling time formula assumes that every cell in the population has an equal probability of dividing in any given time interval, that the environment is uniform (no nutrient gradients, no localized waste buildup), and that no cell is lost to death, migration, or differentiation during the interval.
These assumptions are approximately true for short intervals in mid-log phase for healthy cultures. They break down at the boundaries (lag, stationary, death) and under stress (apoptosis induction, nutrient starvation, heat shock).

Cell Culture Media Preparation Calculator
Key facts about cell doubling time and PDL
- Doubling time (Td) is the time required for a cell population to double in number during log-phase growth. Typical values vary widely with cell type, medium, density, serum lot, passage history, and measurement method.
- Specific growth rate (µ) is the slope of the log-linear growth curve, in units of inverse time. The relationship is µ = ln(2) / Td, or equivalently Td = ln(2) / µ.
- Population doubling level (PDL) is the cumulative number of doublings since isolation, thaw, or a defined starting point. PDL is usually more informative than passage number for finite primary cultures because split ratios can vary between passages.
- Hayflick limit refers to the finite replicative capacity of normal, non-immortalized cell populations in culture. Classic human diploid fibroblast experiments showed a limited lifespan, often summarized as roughly 40 to 60 population doublings, but the practical range depends on donor, tissue, culture conditions, and cell type.
- Stem-cell drift thresholds are practical quality-control guides, not true Hayflick limits. hiPSC, mESC, and hMSC cultures require monitoring for karyotypic drift, differentiation tendency, marker expression, and functional performance according to each lab’s protocol.
- Continuous or immortalized cell lines such as HeLa, HEK293, and Jurkat do not have a classical Hayflick limit. Track passage number, PDL, authentication status, and culture conditions for reproducibility rather than senescence prediction.
How the doubling time calculator works
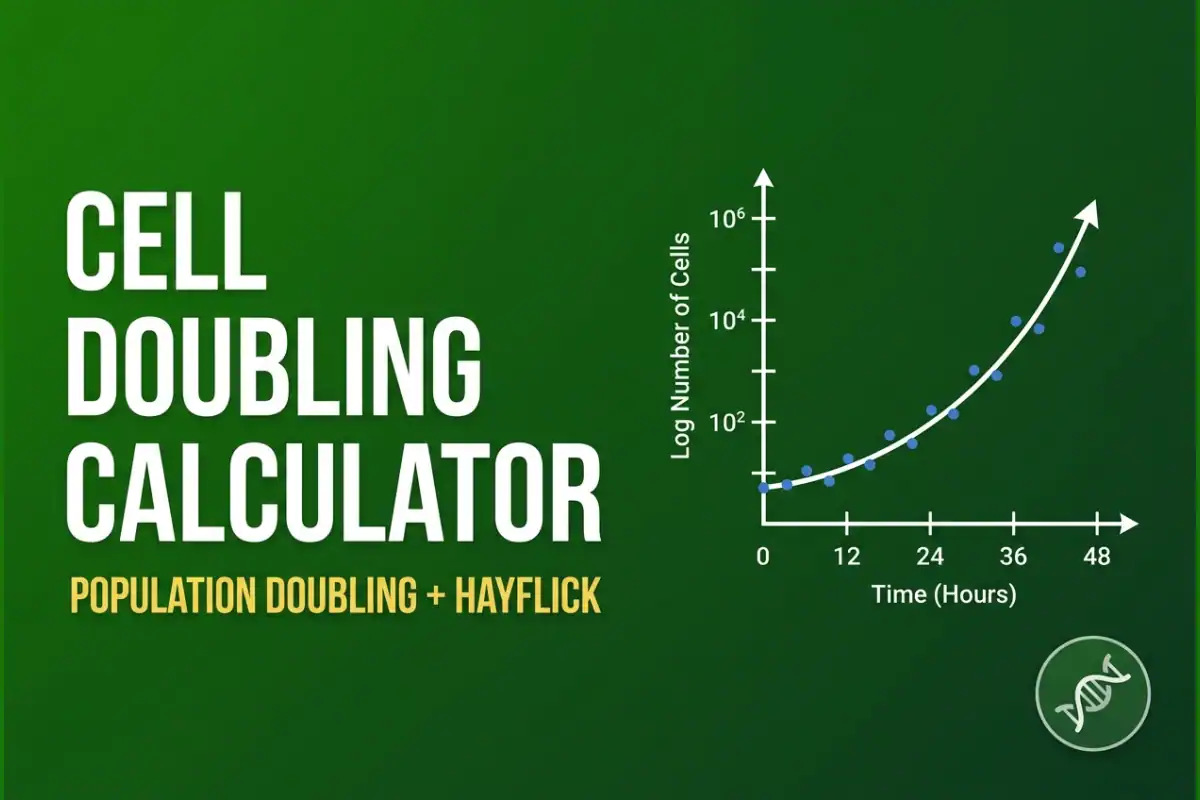
The 2-point doubling time is computed from the closed-form exponential growth equation. Given a starting count N1 at time t1 and an ending count N2 at time t2, the doubling time Td is the time required for the population to double, which gives the formula:
Td = (t2 – t1) × ln(2) / ln(N2 / N1)
The specific growth rate µ is the slope of ln(N) versus time, which is the same quantity expressed in different units:
µ = ln(N2 / N1) / (t2 – t1) and Td = ln(2) / µ
The batch log-phase mode generalizes the 2-point calculation to a time series of measurements. The calculator performs an ordinary least-squares regression of ln(N) on t, where t is time in hours and N is the cell count. The slope of the regression line is µ, and the doubling time Td = ln(2) / µ. The coefficient of determination R² reports the goodness of fit. R² values above 0.95 indicate a clean log-linear growth phase; values below 0.95 suggest that the data includes lag, stationary, or decline phases and should be trimmed before fitting.
The dilution factor input is essential when a sub-sample was diluted before counting. If you diluted 1:10 to fit the counting chamber, multiply the observed count by 10 to recover the original cell density. If your counting software already applied the dilution correction, leave the dilution factor at 1.0.
Worked example 1: 2-point doubling time (HeLa)
HeLa cells are seeded into a 6-well plate at 100,000 cells per well. After 24 hours, the wells are trypsinized and counted, yielding 280,000 cells per well on average. What is the doubling time?
Setup:
N1 = 100,000 cells, t1 = 0 hours, N2 = 280,000 cells, t2 = 24 hours, dilution factor = 1.
Calculation:
ratio = N2 / N1 = 2.8
Td = 24 × ln(2) / ln(2.8) = 24 × 0.6931 / 1.0296 = 16.15 hours
µ = ln(2.8) / 24 = 0.0429 h⁻¹
doublings in interval = log2(2.8) = 1.49
Results:
The doubling time of 16.15 hours is faster than the HeLa typical of 22 hours. Possible explanations: rich media (10% fetal bovine serum with extra glucose), under-trypsinization leaving cell clumps counted as single cells, or genuinely fast growth in mid-log phase. A recount with a different method (trypan blue + automated counter) would help rule out counting artifacts.
Worked example 2: batch log-phase (hiPSC time series)
A human induced pluripotent stem cell (hiPSC) culture is sampled at 24-hour intervals during the log phase of growth. Counts: 50,000 at 0h, 75,000 at 24h, 115,000 at 48h, 175,000 at 72h, 268,000 at 96h. What is the doubling time, and is the fit reliable?
Setup:
Five (time, count) pairs in log phase. No dilution factor needed (counts are absolute).
Calculation:
The calculator performs a log-linear regression of ln(N) versus t. The slope is the specific growth rate µ, and the doubling time is Td = ln(2) / µ.
slope = 0.01752 h⁻¹, intercept = 11.37 (so N0 = e^11.37 = 86,000 at t = 0 if the regression is extrapolated)
Td = ln(2) / 0.01752 = 39.57 hours
R² = 0.9998 (excellent log-linear fit)
Results:
The doubling time of 39.57 hours is within the published hiPSC range of 28-40 hours. The R² of 0.9998 confirms a clean log-linear phase. The extrapolated N0 of 86,000 is higher than the observed 50,000 at t = 0, suggesting the t = 0 measurement was taken just as cells were entering log phase, slightly below the steady-state log-phase cell density.
Worked example 3: single-passage PDL (CHO-K1)
A CHO-K1 (Chinese Hamster Ovary) culture is seeded at 200,000 cells in a T25 flask. After 96 hours (4 days), the cells are trypsinized and counted: 2,200,000 total cells harvested. The cells are then split 1:10 into a new flask. What is the PDL increase, the equivalent doubling time, and the cumulative PDL if the starting PDL was 0?
Setup:
N0 = 200,000, Nf = 2,200,000, split ratio = 10 (1:10), duration = 96 hours, starting PDL = 0.
Calculation:
PDL_increase = log2(Nf / N0) = log2(2,200,000 / 200,000) = log2(11) = 3.46
Equivalent Td = 96 × ln(2) / ln(11) = 27.74 hours
Cumulative PDL = 0 + 3.46 = 3.46
Results:
The PDL increase of 3.46 means the population underwent 3.46 doublings during this passage. The equivalent doubling time of 27.74 hours is slightly slower than the CHO-K1 typical of 19 hours; this is reasonable for a passage that included seeding, lag, and log phases, with the average rate across the full 96-hour window including some non-log time. The cumulative PDL of 3.46 is the starting point for the next passage.
Worked example 4: cumulative PDL with Hayflick warning
A primary fibroblast culture has been maintained for 15 passages. The passage log shows declining cell yields over time, which is a classic sign of approaching senescence. The Hayflick limit for primary fibroblasts is 50 doublings. What is the cumulative PDL after 15 passages, and is the culture approaching the limit?
Setup:
Starting PDL = 0. Fifteen passage rows, each with cells seeded, cells harvested, days in culture, and split ratio. Yields decline from 1,800,000 at passage 1 to 600,000 at passage 15.
Calculation:
The calculator sums log2(Nf / N0) across all 15 passages to give the cumulative PDL. For the simplified data, the cumulative PDL is approximately 45.8 doublings.
pct_to_Hayflick = 45.8 / 50 × 100 = 91.6%
Results:
The culture is at 91.6% of the Hayflick limit. Phase III senescence is expected within 2-5 additional passages. If continued culture is required, prepare a fresh vial from the original stock; do not rely on the current culture for experiments that require consistent proliferation rates.
Cell line doubling time reference
The calculator’s preset dropdown pre-loads typical doubling time values from the Bioprocesstools and SnapCyte cell-line databases, cross-checked against ATCC, Cellosaurus, and primary literature. The “typical” value is the midpoint of the published range; the interpretation bands use the full range.
Common cell lines and their typical doubling times:
- HeLa (human cervical carcinoma): ~22 hours, immortalized, no Hayflick limit.
- HEK293 (human embryonic kidney): ~25 hours, immortalized via adenoviral E1A/E1B, no Hayflick limit.
- HEK293T (with SV40 T-antigen): ~26 hours, immortalized, no Hayflick limit.
- CHO-K1 (hamster ovary, adherent or suspension): ~19 hours, immortalized, widely used in bioprocessing.
- Jurkat (human T lymphocyte, suspension): ~26 hours, immortalized, common for immunology research.
- Vero (African green monkey kidney): ~26 hours, immortalized, common for vaccine production.
- MCF-7 (human breast adenocarcinoma): ~35 hours, immortalized, slower than most cancer lines.
- A549 (human lung carcinoma): ~26 hours, immortalized, common for lung cancer research.
- NIH-3T3 (mouse embryonic fibroblast): ~21 hours, immortalized but contact-inhibited.
- HUVEC (human umbilical vein endothelial, primary): ~39 hours, finite lifespan, Hayflick limit ~15-25 doublings.
- Primary fibroblast (neonatal, generic): ~60 hours, finite lifespan, Hayflick limit ~40-60 doublings.
- MRC-5 (fetal lung fibroblast, finite): ~56 hours, Hayflick limit ~50-70 doublings.
- WI-38 (fetal lung fibroblast, finite): ~56 hours, Hayflick limit ~45-55 doublings.
- hiPSC (human induced pluripotent stem cell): ~34 hours, pluripotent, practical limit ~60-80 passages.
- hMSC (human mesenchymal stem cell, adult stem): ~38 hours, drift limit ~15-25 passages.
- mESC (mouse embryonic stem cell): ~14 hours, pluripotent, practical limit ~30-50 passages.
- Hybridoma (mouse antibody-producing, suspension): ~21 hours, immortalized, used for monoclonal antibody production.
- Sf9 (insect, Spodoptera frugiperda): ~26 hours, used in baculovirus expression systems.
For a cell line not in the preset list, select Custom at the top of the dropdown and enter your own values. Custom presets do not enable interpretation bands; the doubling time is reported without comparison to a typical range.
Population Doubling Level (PDL) vs. passage number
Passage number is the operational count of how many times a culture has been split since isolation or thaw. Population doubling level (PDL) is the cumulative number of doublings. The two numbers diverge when split ratios vary. A 1:2 split gives 1.0 doubling per passage; a 1:10 split gives 3.3 doublings; a 1:20 split gives 4.3 doublings.
For continuous or immortalized cell lines such as HeLa, HEK293, and Jurkat, passage number plus split ratio, seeding density, medium, and authentication history are often the most useful reproducibility records. PDL can still be tracked, but it should not be interpreted as a senescence countdown for these lines.
For primary cells, finite cell lines (MRC-5, WI-38, HUVEC at low passage), and stem cells (hiPSC, mESC, hMSC), PDL is the biologically meaningful metric. A primary fibroblast at “passage 12” might be at PDL 25 or PDL 50 depending on split ratios used. Tracking PDL is the only reliable way to know whether a culture is approaching the Hayflick limit or the practical pluripotency boundary.

Where Do Stem Cells Come From?
Hayflick limit, senescence, and pluripotency drift
The Hayflick limit is the finite replicative capacity of normal, non-immortalized cell populations in culture. Leonard Hayflick and Paul Moorhead’s classic 1961 work showed that human diploid cell strains have a limited in vitro lifespan rather than unlimited growth. Replicative senescence is strongly associated with telomere shortening and cell-cycle checkpoint pathways, although the exact practical limit varies by cell type and culture conditions.
Continuous or immortalized cell lines bypass finite replicative lifespan through mechanisms such as telomere maintenance, viral oncogene effects, checkpoint disruption, selection during long-term culture, or alternative lengthening of telomeres. For these lines, the classical Hayflick limit does not apply. Track passage number, PDL, and culture conditions for reproducibility, not for senescence prediction.
Pluripotent stem cells such as hiPSC and mESC are not usually managed by a classical Hayflick-limit rule. The practical concern is culture quality: karyotypic drift, genetic or epigenetic change, differentiation tendency, loss of marker expression, or reduced differentiation efficiency. Passage thresholds are therefore lab- and protocol-specific quality-control decisions rather than universal biological limits.
Common pitfalls in doubling time and PDL calculations
- Counting units inconsistent across timepoints. If N1 is in cells/well and N2 is in cells/mL, the ratio is meaningless. Always use the same unit for both counts.
- Dilution factor double-applied. If the counting software already corrected for dilution and you also enter a dilution factor, the result is N²× too high. Use 1.0 for no manual correction.
- Lag phase contamination. Including t=0 (immediately post-seeding) as timepoint 1 gives a Td inflated by the lag phase. Use timepoints from mid-log phase (typically 12-48h post-seeding for adherent cells).
- Stationary phase contamination. Counting cells in stationary phase gives a Td much slower than log phase. Either take measurements only during log phase or restrict the batch fit to a clean log-phase window.
- Confluence vs. count. Image-based confluence (percent area covered) is not the same as cell count. Convert confluence to counts using a calibration curve, then use the counts in the calculator.
- Wrong time unit. Typing “7” for a 7-day experiment in an hours-only calculator gives a Td 24× too small. Use the time unit toggle to switch between hours and days.
- PDL miscounted as passage number. A 1:20 split is 4.3 doublings, not 1. Track PDL explicitly with log2(Nf/N0) per passage.
Limits of the calculator
- Exponential growth only. The calculator fits the standard exponential model, valid during log phase. For sigmoidal growth curves (lag + log + stationary) or nutrient-limited kinetics, use a dedicated growth curve fitting tool that includes logistic, Gompertz, or Monod models.
- No viability correction. The calculator uses total cell counts. If viability is below 90% (e.g., after a freeze-thaw cycle or stress treatment), consider correcting viable counts via trypan blue or a similar method before computing Td or PDL.
- No population heterogeneity modeling. The exponential model assumes uniform growth rate. Cultures with subpopulations (G0-arrested cells, differentiating cells, dying cells) will give a fit that averages over the heterogeneity. For subpopulation analysis, use flow cytometry or single-cell tracking.
- Cell-line presets are midpoints, not exact values. The Bioprocesstools, SnapCyte, ATCC, and Cellosaurus databases all show ranges; the preset uses the midpoint. Actual Td in your lab depends on media, serum lot, incubator conditions, and operator technique. Use the preset as a sanity check, not as an expected value.
- Pluripotency limits are practical cutoffs, not absolute. The hiPSC 60-80 passage range and mESC 30-50 passage range are guidelines based on published culture practices. Some labs maintain hiPSC at passage 100+ with careful monitoring; others observe drift by passage 30. The calculator reports the guideline; your lab’s actual drift pattern may differ.
Related resources
For related calculations in cell biology, genetics, and bioprocess engineering, see these BioExplorer tools:
- Annexin V/PI Apoptosis Calculator: compute viability and apoptotic populations from flow cytometry data.
- Cell Biology Tools: the full collection of cell biology calculators on BioExplorer.
- Biology Tools and Calculators: the main BioExplorer tools directory, covering cell biology, genetics, botany, and bioprocess engineering.
- Punnett Square Calculator: for inheritance pattern analysis, useful when working with primary cell lines derived from crosses.
- Specific Leaf Area Calculator: plant-focused calculators, including leaf trait, seed germination, and photosynthesis tools.
Frequently Asked Questions
Cell doubling time (Td) is the time required for a cell population to double in number during log-phase growth. The standard formula is Td = (t2 – t1) × ln(2) / ln(N2/N1), where N1 and N2 are cell counts at times t1 and t2. Typical Td values range from 12-16 hours for mESC to 40-60+ hours for primary fibroblasts.
PDL per passage = log2(Nf / N0), where N0 is cells seeded at the start of the passage and Nf is cells harvested at the end. Cumulative PDL is the sum of log2(Nf/N0) across all passages. The equivalent calculation in log10 form is PDL = 3.32 × (log10(Nf) – log10(N0)); both forms give the same numerical value.
The Hayflick limit is the maximum number of population doublings a normal (non-immortalized) cell culture can undergo before entering replicative senescence, typically 40-60 doublings for primary human fetal fibroblasts. It applies only to finite cell types (primary fibroblasts, HUVEC at low passage, MRC-5, WI-38) and to adult stem cells approaching their drift limit. It does not apply to immortalized lines (HeLa, HEK293, Jurkat, A549, MCF-7, etc.) or to pluripotent stem cells (hiPSC, mESC), which have practical passage limits rather than classical senescence.
The specific growth rate µ is the slope of ln(N) versus time during log phase, in units of inverse time. The relationship to doubling time is µ = ln(2) / Td, or equivalently Td = ln(2) / µ. For example, a Td of 24 hours gives µ = 0.0289 h⁻¹; a Td of 12 hours gives µ = 0.0578 h⁻¹. The growth rate is negative when the population is declining (apoptosis, necrosis).
R² values above 0.95 indicate a clean log-linear growth phase. Values between 0.90 and 0.95 suggest that one or two points may be off (likely measurement error or a transition into or out of log phase). Values below 0.90 indicate that the data is not log-linear; the calculator warns when R² falls below 0.95 and recommends removing non-log-phase points. R² is also sensitive to sample size: a fit with 3 points has only 1 degree of freedom, so a single noisy point can drop R² dramatically; aim for at least 4-5 log-phase points.
Passage number is the operational count of how many times a culture has been split. Population doubling level (PDL) is the cumulative number of doublings. A 1:2 split gives 1.0 doubling per passage; a 1:10 split gives 3.3 doublings; a 1:20 split gives 4.3 doublings. The two numbers diverge when split ratios vary. For continuous (immortalized) cell lines, passage number is usually sufficient for reproducibility. For primary cells, finite lines (MRC-5, WI-38, HUVEC), and stem cells (hiPSC, mESC, hMSC), PDL is the biologically meaningful metric because it tracks cumulative doublings against the Hayflick limit or the pluripotency drift boundary.
The exponential growth model that the calculator uses is valid only during log phase. If your data includes lag, stationary, or death phase points, the fit will be poor (low R²) and the doubling time will be misleading. Take measurements only during the log phase window (typically 12-72 hours post-seeding for adherent cells, depending on the line). If you need to characterize lag, stationary, or death phases, use a sigmoidal model (logistic, Gompertz) or a nutrient-limited model (Monod) in a dedicated growth curve fitting tool.
Yes. The math is identical for adherent and suspension cultures. The cell counting method differs (suspension cells are counted directly without trypsinization, while adherent cells are trypsinized first to detach them), but the inputs to the calculator are total cell counts or cells per mL, which are the same units for both. The preset dropdown notes which lines are typically grown in suspension (Jurkat, hybridoma) versus adherent (HeLa, HEK293, CHO-K1, hMSC), but this is informational only; the math does not depend on it.
The PDL formula log2(Nf / N0) returns a negative value when Nf < N0 (population loss). The calculator reports this as a negative PDL delta and includes a warning. Common causes: poor recovery after trypsinization, mechanical damage during pipetting, or cell death during the passage. To minimize loss, optimize trypsin exposure time, use gentle pipetting, and check viability with trypan blue before recording the harvest count. For routine cultures, occasional negative passages are normal; persistent negative PDL deltas suggest a culture health problem.
The BioExplorer Cell Doubling Time and PDL Calculator is a free educational tool for cell culture math, covering exponential growth rate, log-phase doubling time, and population doubling level tracking across passages. It accepts 2-point and batch log-phase data on the doubling time side, and single-passage or cumulative passage-log data on the PDL side. Eighteen cell-line presets supply typical doubling times and Hayflick or pluripotency limits; a custom preset lets you enter your own values. All math runs in the browser; no data is sent to a server.
For routine cell culture work, this tool replaces the hand-calculated Td = Δt × ln(2) / ln(N2/N1) and PDL = log2(Nf/N0) formulas. The interpretation band chart, lag-phase warning, dilution-factor correction, fold-change limit detection, and R²-based fit quality assessment catch the most common errors in routine culture work. For sigmoidal or nutrient-limited growth curves, use a dedicated growth curve fitting tool.
References: ATCC Animal Cell Culture Guide; Hayflick and Moorhead 1961; Shay and Wright 2000; Cellosaurus cell-line resource.
Cite this page
BioExplorer. (2026, September 30). Cell Doubling Time and PDL Calculator. https://www.bioexplorer.net/cell-doubling-time-pdl-calculator/