
Corrected Total Cell Fluorescence (CTCF) Calculator
Corrected Total Cell Fluorescence (CTCF) Calculator, paste Integrated Density, Area, and Background mean gray value from your ImageJ/Fiji Results table to get the per-ROI background-subtracted fluorescence. Works for any single-channel widefield fluorescence image: 8-bit, 16-bit, 32-bit float, or intensity-calibrated.
CTCF = Integrated Density − (Area × Background mean) = Area × (Cell mean − Background mean).
The result is an area-scaled background subtraction, not a normalization. See the worked examples below for the full math, and the Common Mistakes section for the edge cases that catch most real errors.
Corrected Total Cell Fluorescence (CTCF) Calculator
Background-subtract Integrated Density measurements from ImageJ/Fiji. Works for any single-channel widefield fluorescence image.
What is CTCF and what does it actually do?
Corrected Total Cell Fluorescence (CTCF) is a per-ROI background-subtraction correction, scaled by the ROI area. It subtracts an estimate of the background contribution proportional to the ROI’s pixel count.
CTCF does subtract the area-proportional estimated background from the cell’s Integrated Density. CTCF does not normalize for cell size, shape, focal-plane effects, optical depth, or 3D volume. A small cell with concentrated signal and a large flat cell with the same total signal will have different CTCF values because the background subtractions differ; the comparison is not “apples to apples” without additional normalization (e.g. dividing by area to get mean corrected intensity, or by 3D volume for volumetric comparisons).
| Does | Does not |
|---|---|
| Subtracts the area-proportional estimated background from the cell’s Integrated Density | Normalize for cell size or shape |
| Reveals whether the cell’s mean signal exceeds the local background | Correct for focal-plane effects, optical depth, or out-of-focus light |
| Works for any single-channel fluorescence measurement (8-bit, 16-bit, 32-bit float) | Handle saturated pixels (caller must check Max gray value) |
| Works for any ROI shape (rectangle, oval, polygon, freehand) | Handle multi-channel images (caller must split channels in ImageJ first) |
How to get these numbers from ImageJ/Fiji
- Draw a selection (ROI) around the cell of interest using the rectangle, oval, polygon, or freehand tool.
Analyze → Set Measurements: check Area, Integrated Density, Mean gray value, and ideally Min & Max Gray Value (for saturation detection).Analyze → Measure(Ctrl/Cmd+M): adds a row to the Results table.- Select a nearby region with no fluorescence signal (background) and measure it the same way. 3+ background readings averaged is recommended.
- Repeat for every cell of interest, using the same image and the same acquisition settings (exposure, gain, laser power) throughout, a background or cell reading from a different acquisition invalidates the correction (different intensity scale).
- The Results table (Label, Area, Mean, IntDen columns; optionally Min, Max) is what gets pasted into the calculator.
Worked examples
Example 1: Basic single cell
| Field | Value |
|---|---|
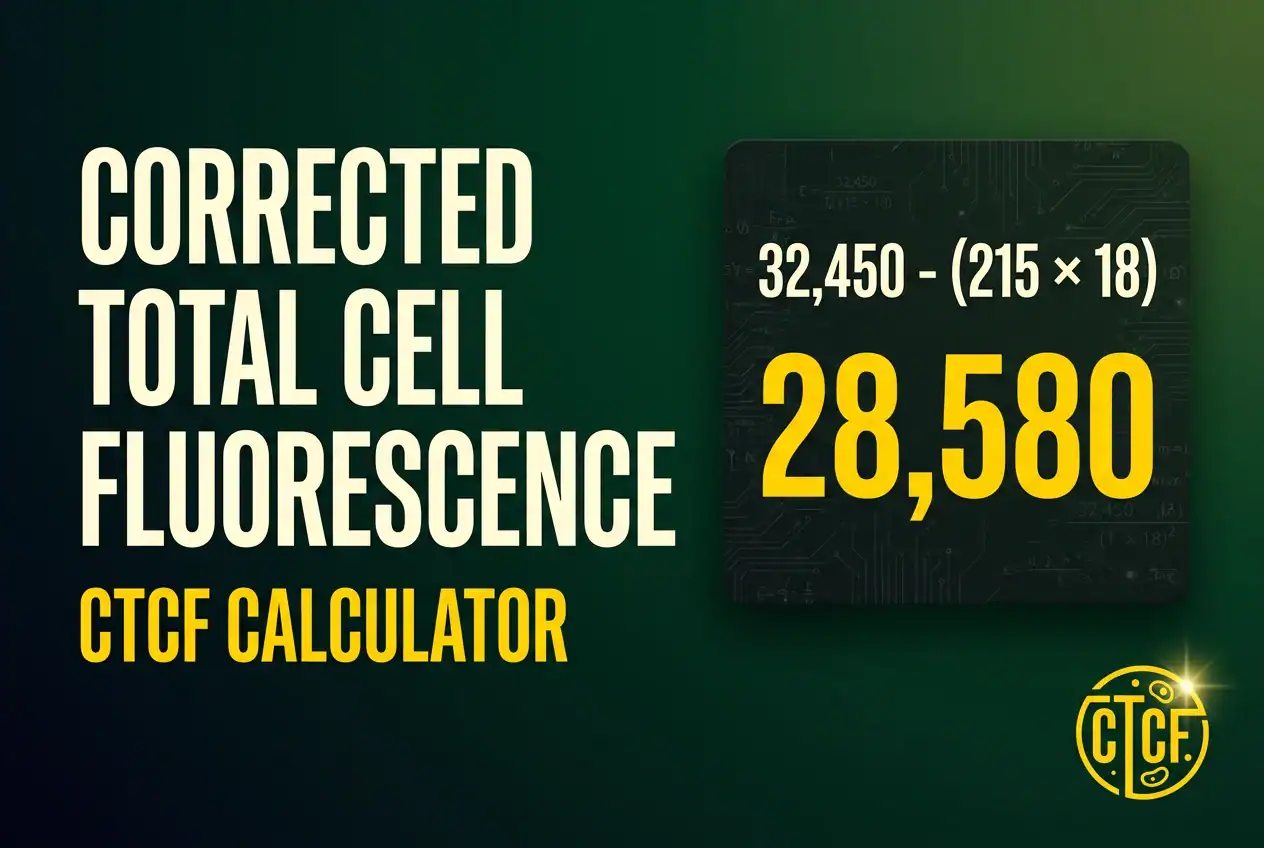
| Integrated Density | 32,450 |
| Area | 215 px² |
| Background mean | 18 |
| CTCF | 32,450 − (215 × 18) = 32,450 − 3,870 = 28,580 |
Example 2: Two cells, identical raw IntDen, different areas
| Cell | Area (px²) | Mean gray value | Integrated Density | Background mean | CTCF |
|---|---|---|---|---|---|
| Interphase (flat) | 450 | 100 | 45,000 | 12 | 45,000 − (450×12) = 39,600 |
| Mitotic (rounded) | 180 | 250 | 45,000 | 12 | 45,000 − (180×12) = 42,840 |
Both cells have identical raw IntDen, but that does not establish identical background-corrected cellular fluorescence, raw IntDen includes estimated background, and the two ROIs have different areas. The larger ROI contains a larger estimated background contribution (5,400 vs 2,160), so the calculated CTCF values differ.
This example demonstrates area-proportional background subtraction; it does not establish a biological difference between the cells. The remaining gap can reflect ROI segmentation, the uniform-background assumption, intensity-calibration differences, or genuine biological variation; CTCF cannot distinguish them.
Example 3: Negative CTCF from a bad background ROI
| Field | Value |
|---|---|
| Integrated Density | 1,350 (Area 90 × Mean 15) |
| Area | 90 px² |
| Background mean | 25 (sampled over a bright artifact) |
| CTCF | 1,350 − (90 × 25) = 1,350 − 2,250 = −900 |
Triggers the negative-CTCF warning. Possible causes include: a background ROI contaminated with a bright structure, an edge, or an autofluorescent region; a misplaced cell ROI; signal genuinely at or below background; mismatched images, channels, or acquisition settings between cell and background measurements; preprocessing that altered the dynamic range; calibration units that don’t match; or random noise. Investigate before reporting the value. The size of the background ROI does not directly affect the correction, only the mean does.
Example 4: Batch with averaged background and descriptive stats
Three background ROIs measured and averaged: 10, 14, 12 → mean background = 12.
| Cell | Area (px²) | Mean gray value | Integrated Density | CTCF |
|---|---|---|---|---|
| A | 300 | 80 | 24,000 | 24,000 − (300×12) = 20,400 |
| B | 250 | 95 | 23,750 | 23,750 − (250×12) = 20,750 |
| C | 310 | 70 | 21,700 | 21,700 − (310×12) = 17,980 |
Descriptive cell-level statistics (no SEM, see the pseudoreplication callout below): n = 3 cells (NOT 3 biological replicates), mean CTCF = 19,710, sample SD (n − 1) ≈ 1,508, median = 20,400, IQR = 2,770 (Tukey median-of-halves convention).
The page must display a prominent note: “n = 3 cells from one image. Cells from a single image are not independent biological replicates; treat these statistics as descriptive only.” No SEM is shown; no outlier flagging runs.
Example 5: Calibrated units mismatch
Image calibrated at 0.5 µm/pixel (1 px² = 0.25 µm²):
| Field | Correct (calibrated) | If units are mixed (the mistake) |
|---|---|---|
| Area | 112.5 µm² | 450 px² (wrong unit for this IntDen) |
| Mean gray value | 100 | 100 |
| Integrated Density | 11,250 | 11,250 |
| Background mean | 12 | 12 |
| CTCF | 11,250 − (112.5 × 12) = 9,900 | 11,250 − (450 × 12) = 5,850 (wrong) |
The “compute expected IntDen from Area × Mean and compare; warn if they differ by more than ~1%” rule catches this. Supply the cell Mean field in the calculator to enable the mismatch check.
Why raw Integrated Density can mislead you
Raw Integrated Density is the product of Area and Mean (IntDen = Area × Mean). For a constant total signal in uncalibrated, pixel-only images, IntDen is unchanged; what changes for the same total signal packed into a different area is the mean intensity.
Whether mean intensity or total corrected fluorescence is the appropriate quantity depends on the biological endpoint; CTCF’s job is not to decide that. CTCF is a per-ROI area-proportional background subtraction. It does not establish what the underlying “true” cellular fluorescence is, and the difference between two CTCF values can reflect ROI segmentation, the uniform-background assumption, intensity-calibration differences, or genuine biological variation; the math alone cannot tell.
Common mistakes
- Mixed acquisitions in one batch. All cell and background readings must come from the same image at the same exposure, gain, and laser power. The calculator shows a hard red-bordered callout around the batch-mode output panel for this reason.
- Saturated pixels. If Max ≥ the user-confirmed effective clipping value, the calculation warns about possible saturation. Saturated pixels underestimate true fluorescence, and no background correction can fix that after the fact, re-image at a lower exposure or gain.
- Background sampled over a bright structure or artifact. Produces a negative CTCF (Example 3). The size of the background ROI does not directly affect the correction, only the mean does. Re-measure the background in a clean region.
- Units mismatch between Area and IntDen. Example 5. The 1% rule (IntDen should equal Area × Mean within 1%) catches this if you supply the cell Mean field.
- Auto-detecting bit depth from Mean. A dim 12-bit or 16-bit image can have max Mean ≤ 255. The dropdown must be user-confirmed.
- Treating 3 cells as 3 biological replicates. Cells from a single image are observational units, not necessarily independent biological replicates. SEM across cells from one image is misleading. The calculator labels n as “number of cells” and shows a prominent pseudoreplication callout.
- Using the container maximum for saturation detection. A 12-bit detector stored in a 16-bit ImageJ image clips at 4,095, not 65,535. The saturation check uses the effective clipping value, not the container maximum. Cameras and acquisition software can left-shift or rescale 12-bit data into the upper part of a 16-bit container, the analyzed image’s actual clipping value is what matters.
- Comparing CTCF values from different ROIs without considering area. CTCF does not normalize for cell size; a smaller cell with concentrated signal and a larger flat cell with the same total signal have different CTCF values.
Scope and known limitations
The v1 tool covers the standard single-time-point, single-channel widefield/epifluorescence use case on a single 2D image. It does NOT cover:
- Nuclear vs. whole-cell measurement. A common variant (e.g. transcription-factor translocation assays measuring nuclear signal only) uses the identical formula but a different ROI-selection strategy. The same calculator works for either, the user chooses what to circle in ImageJ.
- Z-stacks and projections. CTCF is applied to a single 2D image. If the source is a z-stack, project the stack first using ImageJ. Projection type and slice range must be identical across samples: a maximum-intensity projection (MIP), average projection, and sum projection produce materially different intensity measurements. A maximum-intensity projection is a 2D projection metric, not total 3D fluorescence. When total volumetric fluorescence is the endpoint, sum projection or 3D segmentation may be more appropriate.
- Uniform-background assumption. The method assumes fluorescence background is roughly flat across the field of view. Uneven illumination (vignetting) makes a corner background reading unrepresentative of the true background under the cell. This is a real limitation of the classic method.
- Photobleaching correction for live/time-lapse series is a related but distinct problem.
What algorithms does the calculator use?
The v1 batch mode reports descriptive cell-level statistics. Each algorithm is specified so the implementation and the QA tests agree exactly.
Mean (arithmetic average): mean = sum(x_i) / n. For n = 1, mean = the single value.
Sample SD (n − 1 denominator): sd = sqrt( sum((x_i − mean)²) / (n − 1) ). Sample SD uses Bessel’s correction (n − 1). Under standard independent-sampling assumptions, the corresponding sample variance is an unbiased estimator of population variance; the sample SD itself is not exactly unbiased (taking the square root reintroduces bias; NIST uses an additional c4 correction when an unbiased estimate of population SD is specifically required). Sample SD with the n − 1 denominator is the default in Excel STDEV.S, R sd(), Python numpy.std(ddof=1), and ImageJ. For n = 1, SD is undefined. For n = 2, SD has only 1 degree of freedom and is approximate. For n ≥ 3, SD is computed as defined.
Median (middle value): For odd n, median = the middle sorted value. For even n, median = mean of the two middle sorted values.
IQR (interquartile range) project-defined Tukey median-of-halves convention: For odd n, the median is excluded from both halves; Q1 and Q3 are the medians of the resulting halves. For even n, the halves are split at the midpoint; Q1 and Q3 are the medians of the lower and upper halves. IQR = Q3 − Q1. This is a project-defined convention. It does not match R’s IQR() (which defaults to quantile type 7 and gives 1,385 for Example 4 instead of 2,770) and does not generally match Excel’s QUARTILE.EXC. The implementation uses the pseudocode, not R/Excel/numpy.
Small-n behavior:
- n = 1: show only the single CTCF value. Mean and median = the single value. SD and IQR are undefined.
- n = 2: show mean, SD, median. IQR is suppressed by display policy (with only two values there is no genuine inter-quartile spread).
- n = 3 to 4: show all four. Small-n caveat displayed.
- n ≥ 5: show all four. Small-n caveat dropped.
No automatic outlier classification in v1. Sortable values are shown so the user can inspect extremes manually. No SEM by default in v1. v1.1 adds Image ID / Specimen ID columns for multi-image aggregation, and SEM becomes meaningful at the specimen level (but still requires that the aggregation level matches the experimental unit defined by the study design).
IntDen vs. RawIntDen: which to use?
IntDen = Area × Mean gray value (the calibrated product). RawIntDen = the sum of the raw pixel values (uncalibrated). They are equal for uncalibrated, pixel-only images. When both are present in the Results table, prefer IntDen because IntDen respects spatial calibration. If your image has no spatial calibration (Analyze → Set Scale not applied), IntDen and RawIntDen will be numerically identical; using either is fine.
Is this the same as ImageJ’s “Subtract Background” tool?
No, they do different things. ImageJ’s Process → Subtract Background is a rolling-ball algorithm that estimates and subtracts background across the whole image, producing a new image. CTCF is a per-ROI arithmetic correction applied to measurements you have already taken, the image is not modified. Subtract Background is used both for visual presentation and as a quantitative preprocessing step for spatially varying background.
Because Subtract Background modifies pixel values, it must be consistently configured and validated (rolling-ball radius, smoothing, whether to subtract “light background”) before you trust downstream numbers; do not casually combine it with another background correction like CTCF, because the two subtract different estimates of background and the second subtraction may push already-cleaned pixels below zero.
Which fluorescence tool do I need?
- I have a single fixed image (or a maximum-intensity projection) and want to compare fluorescence between cells or conditions → Corrected Total Cell Fluorescence (CTCF) Calculator (this tool).
- I have a time series / live recording and want to see how fluorescence changes over time in the same cell(s) → Calcium Imaging ΔF/F0 Calculator.
- I want to fit a dose-response curve to cell viability data → Cell Viability Dose-Response Calculator.
- I want to compare developmental stages across model organisms → Model Organism Development Stage Converter.
Frequently asked questions
Corrected Total Cell Fluorescence (CTCF) = Integrated Density − (Area × Background mean). It is an area-scaled background subtraction that subtracts an estimate of the local background contribution proportional to the ROI’s pixel count. CTCF does not normalize for cell size, shape, focal-plane effects, optical depth, or 3D volume.
IntDen = Area × Mean gray value (the calibrated product). RawIntDen = the sum of the raw pixel values (uncalibrated). They are equal for uncalibrated, pixel-only images. When both are present, prefer IntDen because it respects spatial calibration.
No. A dim 12-bit or 16-bit image can have a maximum Mean below 255, so the bit depth cannot be reliably inferred from ROI means. ImageJ’s actual image types are 8-bit, 16-bit, and 32-bit float; the bit-depth dropdown must be user-confirmed.
Container type is ImageJ’s image type (8-bit, 16-bit, 32-bit float) and governs the Integrated Density ceiling check. Effective clipping value is the value the analyzed image actually clips at, often different from the detector’s nominal bit depth because acquisition software can left-shift or rescale 12-bit data into the upper part of a 16-bit container. The saturation check uses the effective clipping value, not the container maximum.
Saturation is detected by comparing the Max gray value against the user-confirmed effective clipping value. If Max ≥ the clipping value, the calculator warns about possible saturation. The Min and Max columns are soft-recommended in batch mode; without them, the page displays “Saturation not assessed” and CTCF is still computed.
Cells from a single image are not independent biological replicates. The calculator labels n as the number of cells and shows mean, SD, median, and IQR as descriptive statistics of cell-to-cell variability.
No SEM is shown by default because SEM across cells from one image implies experimental replication that does not exist. v1.1 adds Image ID and Specimen ID columns for multi-image aggregation.
Sample SD uses Bessel’s correction (n − 1). Median is the middle sorted value for odd n and the mean of the two middle values for even n. IQR uses a project-defined Tukey median-of-halves convention: for odd n, the median is excluded from both halves and Q1/Q3 are the medians of the resulting halves.
This convention gives IQR = 2,770 for Example 4 (n = 3); R IQR() and Excel QUARTILE.EXC give different values in general.
No. All computation is client-side. The data file (validation rules and messages) is fetched once on page load, but no user input is uploaded or stored.
Related resources
- Cell Viability Dose-Response Calculator: Fit a 4-parameter logistic model to dose-response data with confidence intervals.
- Model Organism Development Stage Converter: Crosswalk between human, mouse, rat, chick, zebrafish, and Xenopus developmental stages.
- Biology Tools: all BioExplorer calculators and visualizers.
- Cell Biology: the cell-biology sub-hub on BioExplorer.
Methodology and sources
CTCF = Integrated Density − (Area × Background mean).
The mathematical structure (Area, Mean, Integrated Density, Min, Max, RawIntDen as the uncalibrated pixel sum) is documented in the official ImageJ user guide. The application of the method in cell biology is documented in:
- McCloy RA, Rogers S, Caldon CE, Lorca T, Castro A, Burgess A (2014) “Partial inhibition of Cdk1 in G2 phase overrides the SAC and decouples mitotic events.” Cell Cycle 13:1400–1412. https://doi.org/10.4161/cc.28401
For ImageJ’s measurement definitions (the authoritative reference for the underlying ImageJ measurement definitions; Area, Mean, Min/Max, IntDen, and RawIntDen, including the fact that IntDen equals Area × Mean), see the ImageJ user guide. The ImageJ guide defines what each measurement means; the CTCF formula and its application in cell biology are documented in McCloy et al. 2014 (above).
Cite this page
BioExplorer. (2026, August 26). Corrected Total Cell Fluorescence (CTCF) Calculator. https://www.bioexplorer.net/ctcf-calculator/