
Specific Leaf Area Calculator
A specific leaf area calculator is a botany tool that computes Specific Leaf Area (SLA), Leaf Mass per Area (LMA), Leaf Dry Matter Content (LDMC), and an estimated leaf thickness from one leaf sample.
Students and researchers in plant ecology, physiology, and functional trait studies use this calculator to compare species, characterize plant functional types, and explore the leaf economics spectrum.
Specific Leaf Area Calculator
Calculate SLA, LMA, LDMC, and estimated leaf thickness from a single leaf sample. Includes preset samples and a reference comparison.
Sample Inputs
How to Use the Specific Leaf Area Calculator
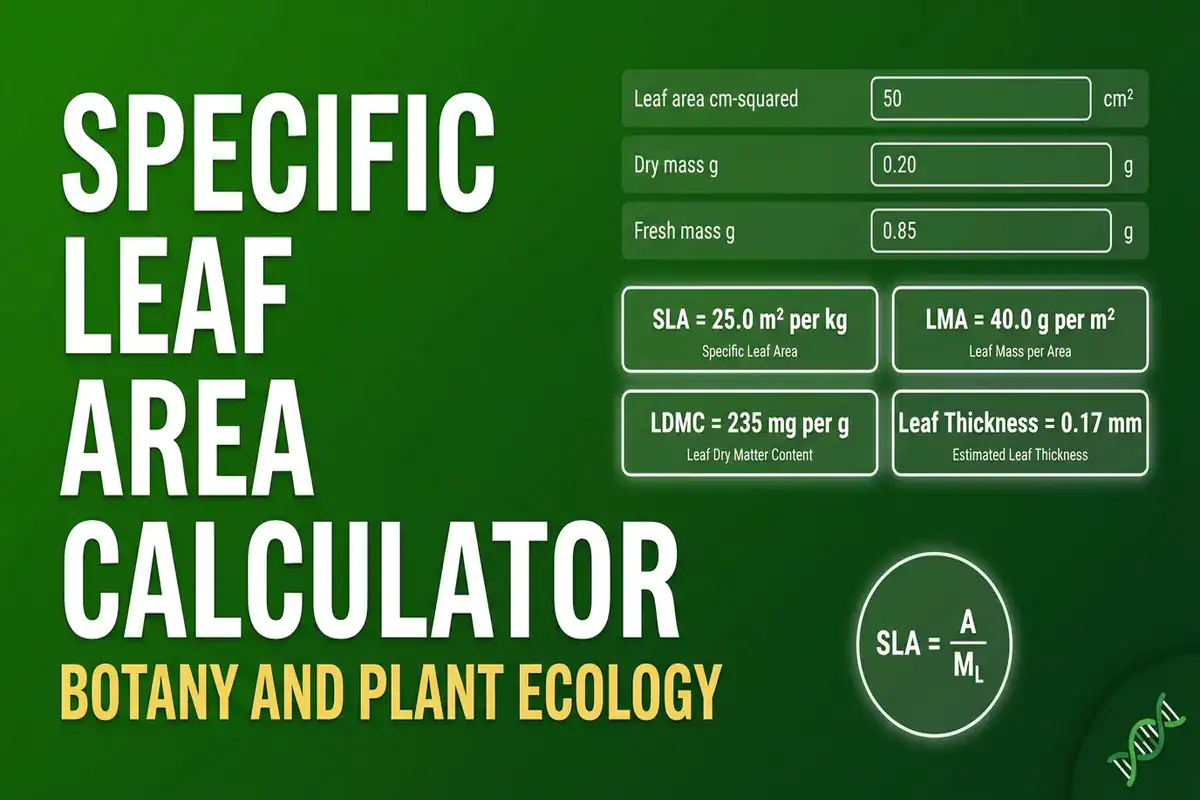
- Enter the one-sided projected leaf area in your preferred unit (cm², mm², m², or in²).
- Enter the oven-dry leaf mass in mg, g, or kg. The SLA calculator outputs both m²/kg and mm²/mg for convenient comparison.
- If you want LDMC and a leaf thickness estimate, also enter the fresh (saturated) leaf mass. The leaf thickness estimate requires both dry mass and fresh mass.
- Pick a functional group from the optional comparison dropdown. The SLA calculator shows whether your sample is below, within, or above the typical range.
- Read the four output cards. The first three give you SLA, LMA, and LDMC. The fourth gives the leaf thickness estimate. The reference comparison appears below.
What Specific Leaf Area Tells You About a Leaf
Specific leaf area (SLA) is the ratio of a leaf’s one-sided projected area to its oven-dry mass. It captures how much leaf area a plant builds per gram of dry biomass. Leaves with high SLA are thin, soft, and built for fast photosynthesis. Leaves with low SLA are thick, tough, and built to last.
SLA is one of the most widely measured plant functional traits in ecology. The TRY plant trait database is a global compilation of plant traits, and SLA is commonly included in functional ecology studies because it is central to leaf economics and plant growth strategy. SLA sits at the center of the leaf economics spectrum, the global trade-off between fast resource acquisition and conservative resource use.
- High SLA (above about 25 m²/kg) usually means the leaf is thin and built for fast growth. Many herbaceous plants, crop leaves, and shade leaves fall in this range.
- Medium SLA (10 to 25 m²/kg) is typical of deciduous trees and most broadleaf shrubs.
- Low SLA (below 10 m²/kg) means the leaf is thick and tough. Evergreen conifers, succulents, and sclerophyll shrubs fall here.
- Leaf dry matter content (LDMC) complements SLA. LDMC is the ratio of dry mass to fresh mass, expressed in mg/g. High LDMC means a larger fraction of the fresh mass is dry structural material; low LDMC means a larger fraction is water.
- Leaf mass per area (LMA) is the inverse of SLA, in g/m². LMA and SLA carry the same information, but LMA is often easier to compare with thickness and density data.
- The three traits together (SLA, LMA, LDMC) describe where a leaf sits on the leaf economics spectrum and how it invests in durable structure versus fast growth.
How the Math Works
The calculator uses standard functional-trait formulas for SLA, LMA, and LDMC, plus the Vile et al. (2005) empirical estimate for leaf thickness. All formulas are unit-aware: the calculator accepts cm², mm², m², or in² for area, and mg, g, or kg for mass, and converts internally.
SLA in m²/kg is the one-sided projected leaf area (A) divided by the oven-dry leaf mass (M_L):
SLA = A / M_L
For practical bench work, leaf area in cm² and dry mass in g are common. The conversion to m²/kg is:
SLA (m²/kg) = (A in cm²) / (M_L in g) / 10
LMA in g/m² is the inverse of SLA:
LMA = 1000 / SLA
LDMC in mg/g is the dry mass divided by the fresh mass (M_F), multiplied by 1000 to express in mg/g:
LDMC = (M_L in g) / (M_F in g) * 1000
Leaf thickness estimate uses the Vile et al. (2005) formula. The relationship SLA × LDMC ≈ 1/thickness holds for laminar leaves, so:
Leaf thickness (mm) = 1000 / (SLA × LDMC)
The SLA and LDMC measurement workflow follows the standardized plant functional-trait protocols summarized by Pérez-Harguindeguy et al. (2013), while the leaf thickness estimate follows Vile et al. (2005).
Methods: How to Measure SLA Properly
The math only works if the measurements follow standard protocols. Here is the workflow used to generate the values in this calculator’s preset samples.
- Collect fresh leaves and rehydrate them overnight in a cool, dark place with the stem in water. This saturates the leaf so the fresh mass is reproducible.
- Pat the leaf dry and weigh it immediately. Record this as the fresh mass in grams.
- Scan the leaf flat on a flatbed scanner, or use a leaf-area meter, to get the one-sided projected area in cm². Avoid curled or overlapping leaves.
- Dry the leaf in a paper envelope at 60-70 °C for at least 72 hours. Cool in a desiccator and weigh immediately. Record this as the oven-dry leaf mass.
- Enter the values into the SLA calculator. The output gives you SLA, LMA, LDMC, and an estimated leaf thickness.
Use the same leaf for all three measurements (area, fresh mass, oven-dry mass). Different leaves give inconsistent results.
Leaf Area Index vs SLA
Leaf Area Index (LAI) is a related but different concept. LAI is the total one-sided leaf area per unit ground area in a canopy, with no units. LAI can be related to SLA when leaf dry biomass per ground area is known. A plant with high SLA contributes more leaf area per gram of biomass, and a canopy of such plants can reach a higher LAI for the same leaf biomass invested.
This calculator works on a single leaf, not a canopy. To estimate LAI from SLA, multiply SLA by leaf dry mass per unit ground area, using consistent units. Most students and researchers measure SLA first and then use the same leaf-area data to estimate LAI in their study plot.
Worked Examples
Example 1: Soybean Leaf (Crop)
A student measures a soybean leaf: 50 cm² area, 0.20 g oven-dry mass, 0.85 g fresh mass.
Setup:
Leaf area: 50 cm². Dry mass: 0.20 g. Fresh mass: 0.85 g. Functional group: Crop leaves.
Calculation:
SLA = (50 / 0.20) / 10 = 25 m²/kg. LMA = 1000 / 25 = 40 g/m². LDMC = (0.20 / 0.85) × 1000 = 235 mg/g. Leaf thickness estimate = 1000 / (25 × 235) = 0.17 mm.
Results:
SLA 25 m²/kg is at the upper end of the crop leaf range (15-25 m²/kg). LDMC of 235 mg/g is in the typical crop range. The leaf thickness estimate of 0.17 mm is consistent with the measured thickness of soybean leaves.
Example 2: Oak vs Pine, Leaf Economics Spectrum in Action
A student compares a deciduous oak leaf to an evergreen pine needle to see the leaf economics spectrum directly.
Setup:
Oak leaf: 30 cm² area, 0.30 g dry mass, 0.90 g fresh mass. Functional group: Deciduous trees. Pine needle: 6 cm² area, 0.12 g dry mass, 0.30 g fresh mass. Functional group: Evergreen conifers.
Calculation (oak):
SLA = (30 / 0.30) / 10 = 10 m²/kg. LDMC = (0.30 / 0.90) × 1000 = 333 mg/g.
Calculation (pine):
SLA = (6 / 0.12) / 10 = 5 m²/kg. LDMC = (0.12 / 0.30) × 1000 = 400 mg/g.
Results:
The oak leaf has double the SLA of the pine needle (10 vs 5 m²/kg) and lower LDMC. This pattern reflects the leaf economics spectrum: deciduous leaves invest less in durable structure and grow faster, while evergreen needles invest more in tough, long-lived tissues. The student’s measurements match the textbook pattern.
Example 3: Spotting a Measurement Error
A student measures a maple leaf and gets SLA 60 m²/kg. They double-check the calculation: leaf area 30 cm², dry mass 0.005 g.
Setup:
Leaf area: 30 cm². Dry mass: 0.005 g. Functional group: Deciduous trees.
Calculation:
SLA = (30 / 0.005) / 10 = 600 m²/kg.
Results:
The SLA calculator flags 600 m²/kg with a warning. That value is far outside normal terrestrial-leaf ranges and usually signals a measurement or unit-entry error. The student checks the dry mass input.
The original measurement was 0.05 g, not 0.005 g. After fixing the decimal point, SLA drops to 60 m²/kg, still high but plausible for a shade leaf. The lesson: the calculator’s warning system catches measurement errors that hand calculations might miss.
Limits of This Calculator
The leaf thickness estimate uses the Vile et al. (2005) empirical relationship, which assumes laminar leaves with simple flat geometry. The estimate becomes unreliable for:
- Cylindrical, needle-shaped, or rolled leaves where the flat-lamina thickness assumption does not apply.
- Highly succulent leaves where the SLA × LDMC product does not scale with thickness.
- Compound leaves where leaflet area does not represent total photosynthetic area.
The reference ranges are coarse approximations from the TRY database. They serve as a quick sanity check, not a precise species-level prediction. For species-specific reference data, use the TRY database directly.
Eastern White Pine
Related Resources
The Specific Leaf Area Calculator is part of the BioExplorer botany tools collection. Refer to Genetics tools page for population genetics calculators and analyzers. For general biology tools, refer to the main hub page.
Types of Plants: The Four Major Classifications of Plants

Types of Trees

Types of Flowers

Botany Glossary
Fernleaf Yarrow
Japanese Bigleaf Hydrangea
Frequently Asked Questions
Specific leaf area (SLA) is the ratio of a leaf’s one-sided projected area to its oven-dry mass. It captures how much leaf area a plant builds per gram of biomass. SLA is measured in m²/kg. High SLA means thin, fast-growing leaves; low SLA means thick, long-lived leaves. This calculator computes SLA from one leaf sample.
Leaf dry matter content (LDMC) is the ratio of oven-dry mass to fresh (saturated) mass, expressed in mg/g. LDMC captures how much of a leaf’s fresh mass is solid tissue versus water. High LDMC (over 350 mg/g) means dry, tough leaves; low LDMC (under 150 mg/g) means watery, soft leaves. The SLA calculator computes LDMC when you provide both the fresh mass and the dry mass.
Leaf mass per area (LMA) is the inverse of specific leaf area, expressed in g/m². LMA = 1000 / SLA. LMA and SLA carry the same information, but LMA is often easier to compare with leaf thickness and tissue density data. The calculator outputs both SLA and LMA in the same view.
Scan the leaf flat on a flatbed scanner at a known resolution, then count the leaf pixels using ImageJ or a similar tool. Multiply pixel count by the area per pixel from your scanner resolution. Alternatively, use a leaf-area meter (LI-COR 3100 or similar) for direct measurement. The calculator accepts the resulting area in cm², mm², m², or in².
Dry leaves in a paper envelope at 60-70 °C for at least 72 hours, or until the mass stops changing between successive weighings. Standard protocols (Pérez-Harguindeguy et al. 2013) recommend drying until constant mass. For thick or succulent leaves, extend drying time. After drying, cool the leaves in a desiccator for 15 minutes before weighing to avoid absorbing atmospheric moisture.
Yes, when you provide both the dry mass and the fresh mass, the calculator outputs a leaf thickness estimate using the Vile et al. (2005) formula: thickness (mm) = 1000 / (SLA × LDMC). This estimate works for laminar (flat) leaves. The estimate becomes unreliable for needle-shaped or highly succulent leaves.
Approximate SLA ranges from published plant-trait compilations: deciduous trees 10-25 m²/kg, evergreen conifers 4-10 m²/kg, C3 grasses 15-30 m²/kg, herbaceous forbs 15-35 m²/kg, succulents 1-5 m²/kg, shade leaves 25-50 m²/kg, crop leaves 15-25 m²/kg. The calculator shows the comparison against these ranges when you pick a functional group from the dropdown.
The numeric value is the same in m²/kg and mm²/mg: 1 m²/kg = 1 mm²/mg. For example, 25 m²/kg equals 25 mm²/mg. The SLA calculator outputs both units automatically.
The Specific Leaf Area Calculator is one of BioExplorer’s interactive botany tools. It computes Specific Leaf Area, Leaf Mass per Area, Leaf Dry Matter Content, and an estimated leaf thickness from a single leaf sample. The math follows the standardized protocols of Pérez-Harguindeguy et al. (2013) and the leaf thickness estimate uses Vile et al. (2005). Reference ranges come from the global TRY plant trait database.
The calculator is educational. Researchers measuring leaf traits for publication should validate against the original papers and follow their lab’s standard operating procedures. BioExplorer accepts no liability for measurement errors made using this tool.
Cite this page
BioExplorer. (2026, September 30). Specific Leaf Area Calculator. https://www.bioexplorer.net/specific-leaf-area-calculator/