
Calcium Imaging Delta F/F0 Calculator
The Calcium Imaging Delta F over F0 Calculator (ΔF/F0 calculator) converts a raw fluorescence time series from a calcium imaging experiment into a normalized trace, with a user-selectable baseline method, summary statistics, and a plotted trace. The tool runs entirely in the browser and supports background subtraction, an F0 override, and bleach-drift screening.
Calcium Imaging ΔF/F0 Calculator
Paste F(t) fluorescence values, pick a baseline method, and get the ΔF/F0 trace, summary statistics, and a downloadable CSV.
How to use the Calcium Imaging Delta F over F0 Calculator
- Paste your F(t) fluorescence values into the text area (one per line, or comma/tab/space separated).
- Optionally enter a background offset B (in the same units as F(t)) if you have a background measurement.
- Choose a baseline method: whole-trace median (default, robust to transients), whole-trace mean, or pre-stimulus mean (requires a pre-stim window).
- If you select pre-stimulus mean, enter the start and end frame indices of the pre-stimulus window (0-based, end-inclusive).
- Optionally override F0 with a user-specified value (post-background; the calculator uses it as F0_effective directly without subtracting B).
- Optionally paste a time column to derive the frame rate; otherwise enter the frame rate directly.
- Pick a display format (percent or fraction).
- Click “Calculate Delta F over F0” to compute the trace, summary statistics, and the two-panel plot. The CSV download button appears once results are computed.
Preparing and checking fluorescence data
Use one ROI-derived fluorescence measurement per frame and apply the same ROI and background-extraction procedure to every recording being compared. If timestamps are supplied, they should be ordered, numeric, and correspond one-to-one with the fluorescence values. Retain the original raw trace and document whether the pasted values have already undergone background, neuropil, motion, or photobleaching correction.
Inspect the source images for saturation, motion, focus changes, ROI displacement, and illumination instability before interpreting a large ΔF/F0 event as biological. A very small positive F0 can produce an extremely large normalized value even when the absolute fluorescence change is modest. For upstream acquisition and image-processing guidance, see BioExplorer’s microscopy methods and cell biology methods and protocols.
What is delta F over F0 in calcium imaging?
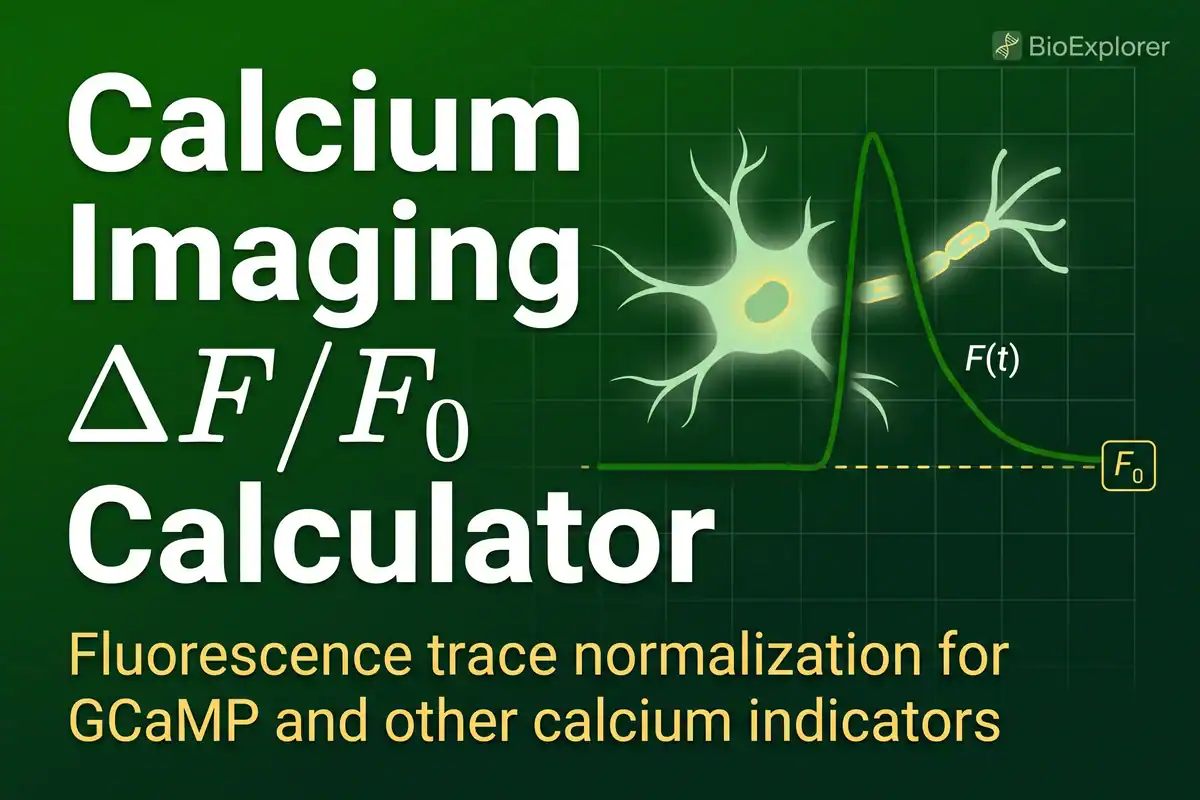
Delta F over F0 is a widely used way to normalize a raw calcium imaging fluorescence trace F(t) relative to a selected reference level. The formula is ΔF/F0 = (F(t) − F0) / F0, where F0 is the baseline fluorescence defined by the chosen method. The output is a unitless ratio (often written as a percent, e.g. 50% means the trace is 50% above baseline).
The Calcium Imaging Delta F over F0 Calculator makes this computation transparent, lets the user pick the baseline method, and shows the underlying arithmetic so the result is auditable.
The choice of F0 baseline matters a great deal in calcium imaging, because transient events associated with action potentials, neurotransmitter release, or sensory responses can dominate short windows.
The same raw F(t) trace can produce noticeably different ΔF/F0 traces depending on which baseline method the user picks. This calculator offers three transparent baseline methods so the choice is explicit and the math is auditable.
Interpreting ΔF/F0 values
A ΔF/F0 value of 0 means that F(t) equals the selected baseline F0. A value of 0.50, or 50%, means fluorescence is 50% above baseline, while −0.20 means it is 20% below baseline. Negative values are not automatically errors; they indicate that the measured fluorescence is below the selected baseline.
ΔF/F0 normalizes a trace to its own baseline, but it is not a direct measurement of intracellular calcium concentration unless the indicator has been appropriately calibrated. It also does not, by itself, make measurements quantitatively comparable across cells, animals, indicators, microscopes, or acquisition settings.
Comparisons require consistent indicator expression, optics, exposure, ROI extraction, background treatment, baseline definition, and preprocessing.
The three baseline methods
- Pre-stimulus mean: F0 is the mean of F(t) over a user-specified time window before the stimulus. This method is often appropriate for trial-based experiments with a defined stimulus onset, provided the selected window represents a stable baseline.
- Whole-trace mean: F0 is the mean of F(t) over the entire recording, which forces mean (ΔF/F0) to equal 0 by construction. Transients and long-term drift affect the mean, so this method should be used only when that convention matches the analysis protocol, not as a substitute for a missing quiescent baseline.
- Whole-trace median: F0 is the median of F(t) over the entire recording. The whole-trace median is BioExplorer’s convenience default because it is less sensitive to transient outliers than the mean. Baseline selection is experiment-specific, however: published workflows use pre-stimulus averages, percentiles, running baselines, and other approaches depending on activity density, drift, and experimental design (see the Sources and further reading section below).
Background subtraction
Background subtraction is an optional pre-step. The calculator computes F_corrected(t) = F_raw(t) − B, where B is a constant background offset (a single number per trace in v1). Subtracting a constant background leaves the numerator (F(t) − B) − (F0 − B) = F(t) − F0 unchanged and changes the denominator to the post-background baseline (F0 − B).
The sign of ΔF/F0 remains unchanged whenever F0_effective is positive. The calculator never compares B to F0_effective; that comparison is meaningless because F0_effective is a post-background quantity.
Photobleaching and the bleach drift warning
Photobleaching is the gradual loss of fluorescence over time as the indicator molecules get damaged by the excitation light. Photobleaching biases the whole-trace mean and whole-trace median downward relative to the initial unbleached baseline, because later frames in the recording are dimmer than earlier frames.
The calculator applies a bleach-drift check to the background-corrected trace: it computes the median of the first ceil(0.1 × n) frames and the median of the last ceil(0.1 × n) frames, and reports the drift as (first − last) / first. If the drift exceeds 5%, the calculator surfaces a yellow warning that this is consistent with photobleaching, focus drift, or illumination drift. The current calculator reports the drift but does not correct it.
How the math works
The calculator implements the canonical background-first, baseline-second pipeline. First it subtracts the background offset B (if any) from every frame. Then it computes F0_effective as either the user-supplied override or the chosen baseline method applied to the already corrected trace. The calculator then hard-errors if F0_effective is not greater than zero.
The ΔF/F0 trace is (F_corrected(t) − F0_effective) / F0_effective for every frame, including the pre-stimulus window. The calculator never compares the background offset to F0_effective, because that comparison is mathematically meaningless; F0_raw equals F0_effective plus B when no override is used, and the only F0-related hard error is F0_effective not being positive.
Worked examples
The calculator ships with six hand-verified worked examples that exercise every baseline method, the background-subtraction option, the photobleaching case, and a deterministic-baseline case. Each example can be loaded by clicking a preset chip below the F(t) textarea. The expected output for each example is documented in PHASE-1-2-DISCOVERY-AND-MATH.md, and the unit tests verify the calculator reproduces the documented numbers exactly.
Example 1: pre-stimulus baseline, 101-frame trace
This is a synthetic calcium-imaging trace designed for hand-verification. Frames 0 to 9 hold 1000 au, frame 50 holds 1500 au, all other frames hold 1000 au, for 101 total frames. With the pre-stim baseline over frames 0 to 9, F0 is 1000 and the peak ΔF/F0 is exactly 50.00%.
Example 2: whole-trace mean and median, 101-frame trace
Fifty frames at 1000 au, one frame at 1500 au at frame 50, fifty frames at 1000 au. The whole-trace mean F0 is 1004.9505 au and the peak ΔF/F0 is 49.26%. The whole-trace median F0 is 1000 au and the peak ΔF/F0 is 50.00%. This example produces two distinct peaks (mean vs median), not three, because the pre-stim baseline would also give 50.00%.
Example 3: fiber-photometry whole-trace median, 600-frame trace
599 frames at 2500 au and one frame at 4200 au (the transient peak) for 600 total frames. The whole-trace mean F0 is 2502.83 au and the peak ΔF/F0 is 67.81%. The whole-trace median F0 is 2500 au and the peak ΔF/F0 is 68.00%. The 68% value is a generic fiber-photometry example within a plausible range, not a literature-derived number.
Example 4: background subtraction, 101-frame trace
A 101-frame synthetic trace with raw baseline 1000 au, raw peak 1015 au at frame 50, and B = 15 au. The corrected baseline (frames 0 to 9) is 985 au and the corrected peak is 1000 au. The peak ΔF/F0 is (1000 − 985) / 985 = 1.52%. This example shows why background subtraction matters: without it the peak would be (1015 − 1000) / 1000 = 1.50%.
Example 5: photobleaching with biological transient, 600-frame trace
This 600-frame synthetic trace combines a linear bleaching trend with a one-frame biological transient. Because the current calculator detects but does not correct photobleaching, the uncorrected peak ΔF/F0 is 74.81% with the whole-trace mean, 74.98% with the whole-trace median, and 44.77% with the pre-stimulus mean. The measured downward drift is 36.78%, so the bleach-drift warning appears. A proportional correction recovers a peak near 50% in the validation fixture, but that correction is not applied by the current calculator.
Example 6: deterministic cosine baseline, 100-frame trace
A 100-frame deterministic cosine baseline F(t) = 1000 + 10 cos(2π t / 10). The whole-trace mean F0 is 1000 au, the peak ΔF/F0 is 1.00% and the min ΔF/F0 is −1.00%. This is a teaching example for the “no transients, only baseline variation” case.
Calcium Imaging Delta F over F0 vs CTCF Calculator
The CTCF (Corrected Total Cell Fluorescence) Calculator works on a single image or a max-intensity projection, computing area-scaled background subtraction for fluorescence comparison between cells or conditions.
The Calcium Imaging Delta F over F0 Calculator works on a time series, computing the per-frame normalized trace ΔF/F0. They cover complementary use cases: CTCF for single images, Delta F over F0 for time series.
When photobleaching correction is warranted, a common processing order is: (1) apply photobleaching correction (F_bleach) to the raw F(t), (2) compute F0 on the bleach-corrected trace, and (3) compute ΔF/F0 = (F_corrected(t) − F0) / F0. The current calculator covers step 2 and step 3; photobleaching correction is not included. CTCF is the appropriate calculation when you have a single image and need to compare fluorescence across cells, not a time series.
Reporting ΔF/F0 results
For reproducibility, report the calcium indicator, biological preparation, acquisition rate, fluorescence-extraction method, background or neuropil correction, F0 method, baseline window, photobleaching treatment, and whether results are expressed as a fraction or percentage.
When using an F0 override, report how that value was obtained. Preserve the raw fluorescence trace alongside the normalized output so the calculation can be independently checked.
Troubleshooting common ΔF/F0 results
- Unexpectedly large peak: Check for a very small F0, a single-frame outlier, detector saturation, motion, or incorrectly parsed input. Because F0 is the denominator, values close to zero can produce extremely large ratios.
- Negative ΔF/F0: This means F(t) is below the selected F0 and is not automatically an error. If the negative values are unexpected, review the baseline window, background offset, focus stability, and photobleaching trend.
- Steady downward trend: This may reflect photobleaching, focus drift, illumination instability, or a genuine biological decline. The bleach-drift warning identifies the pattern but does not determine its cause.
- Mean ΔF/F0 equals zero: This is expected when the whole-trace mean defines F0; the result follows algebraically from the baseline definition.
- Incorrect timing or frame rate: Confirm that the time column contains seconds, is strictly increasing, and has exactly one timestamp for every fluorescence value.
- Different results between baseline methods: This reflects sensitivity to the F0 definition rather than a calculator error. Use the method specified by the experimental design or analysis protocol.
Limits
- The calculator covers a single F(t) trace. Multi-ROI or multi-trial analysis ships in v1.1.
- Photobleaching correction (linear, mono-exponential, and double-exponential models with BIC for model selection) ships in v1.1.
- Neuropil correction (F_soma − r × F_neuropil with r = 0.7 default) ships in v1.1.
- Event detection (basic thresholding with user-configurable parameters) ships in v1.1.
- Deconvolution to spike trains (Vogelstein 2010, Pnevmatikakis 2016, Giovannucci 2019 CaImAn) is out of scope for both v1 and v1.1.
- Image processing (motion correction, ROI segmentation) is not in scope; the input is a pre-extracted F(t) trace.
Sources and further reading
- Peter Rupprecht (2025). How to compute ΔF/F from calcium imaging data. Scientifica learning zone. scientifica.uk.com. Companion tutorial on gcamp6f.com.
- University of St Andrews DataView tutorial. Fluorescent (calcium) image pre-processing. st-andrews.ac.uk. Documents the proportional vs additive correction methods and BIC for model selection.
- Chen, T.-W., Wardill, T. J., Sun, Y., Pulver, S. R., Renninger, S. L., Baohan, A., Schreiter, E. R., Kerr, R. A., Orger, M. B., Jayaraman, V., Looger, L. L., Svoboda, K., & Kim, D. S. (2013). Ultrasensitive fluorescent proteins for imaging neuronal activity. Nature 499, 295-300. doi:10.1038/nature12354. GCaMP6 indicator characterization.
- Zhang, Y., Rózsa, M., Liang, Y., Bushey, D., Wei, Z., Zheng, J., Reep, D., Broussard, G. J., Tsang, A., Tsegaye, G., Narayan, S., Muhammad, A., Li, X., Mun, M., Jayaraman, V., Looger, L. L., & Ahrens, M. B. (2023). Fast and sensitive GCaMP calcium indicators for imaging neural populations. Nature 615, 884-891. doi:10.1038/s41586-023-05828-9. jGCaMP8 indicator characterization and running-baseline methods.
- Miura, K. (2020). Bleach correction for fluorescence microscopy images. F1000Research 9, 1494. pmc.ncbi.nlm.nih.gov/PMC7871415. Simple-ratio, exponential, and histogram-matching bleach correction methods.
- Romano, S. A., Pérez-Schuster, V., Jouary, A., Boulanger-Weill, J., Candeo, A., Pietri, T. G., & Sumbre, G. (2017). An integrated calcium imaging processing toolbox for the analysis of neuronal population dynamics. PLOS Computational Biology 13, e1005526. doi:10.1371/journal.pcbi.1005526. 8th-percentile running baseline with window = 40× decay time constant.
- Giovannucci, A., Friedrich, J., Gunn, P., Kalfon, J., Brown, B. L., Koay, S. A., Taxidis, J., Najafi, F., Gauthier, J. L., Zhou, P., Khakh, B. S., Tank, D. W., Chklovskii, D. B., & Pnevmatikakis, E. A. (2019). CaImAn: an open source tool for scalable calcium imaging data analysis. eLife 8, e38173. doi:10.7554/eLife.38173. CaImAn baseline discussion and source-separation methods for calcium imaging.
Related resources
- CTCF Calculator: Corrected Total Cell Fluorescence for single images.
- Cell Viability Dose-Response Calculator: 4PL fit, EC50, dose-response curves.
- Cell Biology Tools: the parent sub-hub for all cell-biology calculators.
- Cell Biology Glossary: definitions of cell-biology and microscopy terminology.
- Biology Tools: the parent hub for all BioExplorer tools.
Frequently Asked Questions
Delta F over F0 (ΔF/F0) is a widely used way to normalize a raw calcium imaging fluorescence trace F(t) relative to a selected reference level. The formula is ΔF/F0 = (F(t) − F0) / F0, where F0 is the baseline fluorescence defined by the chosen method. The output is a unitless ratio, often written as a percent (50% means the trace is 50% above baseline). The calculator makes the computation transparent and lets the user pick the F0 baseline method. ΔF/F0 does not by itself make measurements quantitatively comparable across different indicators, microscopes, or acquisition settings.
The pre-stimulus mean is often appropriate for trial-based experiments with a defined stimulus onset when the selected window represents a stable baseline. The whole-trace median is BioExplorer’s convenience default because it is less sensitive to transient outliers than the mean, although dense activity or drift can still affect it. The whole-trace mean forces mean(ΔF/F0) to equal 0 by construction and should be used only when that convention matches the analysis protocol. The same F(t) trace can produce different results under different baseline definitions.
Photobleaching is the gradual loss of fluorescence over time as indicator molecules are damaged by excitation light. It can bias whole-trace baseline estimates because later frames are dimmer than earlier frames. The calculator compares the medians of the first and last 10% of frames and displays a yellow warning when the measured downward drift exceeds 5%. The warning is consistent with photobleaching, focus drift, or illumination drift; the current calculator does not correct the trace.
If you have a background measurement (e.g. the mean of three non-fluorescent ROIs), enter it in the Background offset B field. The calculator subtracts B from every frame of F(t) before computing F0. Subtracting a constant background leaves the numerator (F(t) − B) − (F0 − B) = F(t) − F0 unchanged and changes the denominator to the post-background baseline (F0 − B). The sign of ΔF/F0 remains unchanged whenever F0_effective is positive. The calculator does not require B to be smaller than F0_effective; the only hard error is F0_effective not being positive after background subtraction.
Yes. Enter your preferred F0 in the F0 override field. The override is post-background: the calculator uses the override value as F0_effective directly, without subtracting B. The override only needs to be greater than 0. This is the right approach when you have computed F0 elsewhere (e.g. from a different window or a different method) and you want the calculator to use your value rather than re-computing it.
The bleach-drift warning means the median fluorescence in the first 10% of frames is more than 5% above the median in the last 10% of frames. This pattern is consistent with photobleaching, focus drift, or illumination drift, but the warning does not identify the cause. It is evaluated independently of the selected baseline method. The current calculator reports the drift and does not correct the trace.
No. The entire calculation runs in your browser. The F(t) trace you paste stays on the page and never leaves the page. You can use the calculator on a confidential dataset without privacy concerns. The cite-this-tool block at the bottom of the calculator provides the citation for any publication or presentation that uses the calculator.
This calculator implements the standard (F − F0) / F0 normalization for calcium imaging time-series data, with user-selectable baseline methods (pre-stimulus mean, whole-trace mean, whole-trace median) and an optional background offset. The equation is straightforward, but baseline selection and decisions about photobleaching and neuropil correction require experimental judgment. The current calculator reports bleach drift but does not perform photobleaching or neuropil correction. Six hand-verified worked examples exercise every baseline method and the bleach-drift detection.
The tool runs entirely in the browser. No data leaves the page. The unit tests reproduce the documented numbers exactly. Citations are the Scientifica and gcamp6f.com tutorials by Peter Rupprecht (2025), the University of St Andrews DataView tutorial, Chen et al. 2013, Zhang et al. 2023, Miura 2020, and others.
Cite this page
BioExplorer. (2026, September 30). Calcium Imaging Delta F/F0 Calculator. https://www.bioexplorer.net/delta-ff0-calculator/