Chi-Square Calculator
A chi-square calculator is a genetics statistics tool that tests whether the observed offspring counts from a genetic cross match the expected Mendelian ratio. Enter your data, pick the expected ratio (or expected counts), and the calculator returns the chi-square (χ²) test statistic, degrees of freedom, p-value range, critical values, and a plain language interpretation.
Chi-Square Test Calculator
Enter the observed offspring counts from a genetic cross, pick the expected ratio (or expected counts), and the calculator returns the chi-square (χ²) value, degrees of freedom, p-value range, and a plain language interpretation.
How to Use the Chi-Square (χ²) Test Calculator
- Pick the number of phenotype classes: 2 for monohybrid crosses, 4 for standard dihybrid crosses, 3 for incomplete dominance, or 5 if you have a more complex scheme.
- Enter the observed counts from your experiment. Each input corresponds to one phenotype class (round, wrinkled, yellow, green, and so on).
- Choose ratio mode or direct mode. Ratio mode lets you type the expected ratio like 9:3:3:1 and the calculator converts it to expected counts based on your total observed. Direct mode lets you enter expected counts directly if you already have them.
- Read the four headline numbers: chi-square value, degrees of freedom, p-value range, and total observed. The p-value range tells you whether your data fits the expected ratio at the standard 0.05 and 0.01 significance levels.
- Use a preset chip to load a real dataset (Mendel peas, perfect 9:3:3:1 fit, slight deviation, strong deviation) and see the chi-square test in action.
What Is the Chi-Square Goodness of Fit Test?
The chi-square goodness of fit test is a statistical method used in genetics to compare observed offspring counts against the counts you would expect from a hypothesized inheritance pattern.
A Punnett square predicts the expected ratio. A real cross gives you the observed counts. The chi-square test statistic measures how far the observed data deviates from the expected pattern. As a chi-square biology calculator, this tool is designed for the exact workflow of running a Punnett square chi-square test against observed offspring data.
Students encounter the chi-square test in nearly every genetics class. It is one of the most widely used chi-square statistics genetics tools in undergraduate biology. In a Mendelian genetics class, the chi-square Mendelian ratio test is the standard homework exercise, and it is also a basic tool in population genetics and ecology.
The Chi-Square Formula
The chi-square test statistic is calculated by summing the squared difference between observed and expected counts, divided by the expected count, across all phenotype classes:
chi-square = SUM of ( (O – E)2 / E )
where O = observed count, E = expected count
Each chi-square observed expected term in the sum shows how much that single class contributes to the total chi-square value. A large contribution from one class means that class is the main source of deviation from the expected ratio.
The degrees of freedom for a chi-square goodness of fit test equals the number of phenotype classes minus 1. A standard dihybrid cross has 4 classes, so degrees of freedom = 3. A monohybrid cross has 2 classes, so degrees of freedom = 1. The degrees of freedom chi-square test statistic follows the chi-square distribution with that many degrees of freedom.
Interpreting the P-Value
The p-value tells you the probability of seeing your observed data (or more extreme) if the expected ratio is actually correct. The calculator doubles as a chi-square p-value calculator by returning the p-value range so you can decide whether to reject the null hypothesis. Two significance thresholds are commonly used in genetics:
- p > 0.05: fail to reject the null hypothesis. The observed data is consistent with the expected ratio. Any deviation is likely due to random chance.
- 0.01 < p < 0.05: reject the null hypothesis at the 5 percent level. The deviation is significant but not extreme. Worth investigating further.
- p < 0.01: reject the null hypothesis at the 1 percent level. The deviation is highly significant. The expected ratio is probably wrong, or another factor (linkage, epistasis, small sample size) is at play.
The chi-square critical value is the threshold at each significance level. For degrees of freedom = 3, the chi-square critical value at p = 0.05 is 7.815 and at p = 0.01 is 11.345. If your chi-square value exceeds the critical value at your chosen significance level, you reject the null hypothesis.
Worked Examples
Example 1: Mendel Pea Shape (3:1)
Mendel counted 5,474 round seeds and 1,850 wrinkled seeds in his F2 generation. The expected ratio for a monohybrid F1 x F1 cross is 3:1, so expected counts are 5,493 round and 1,831 wrinkled out of 7,324 total.
Setup: 2 classes, ratio 3:1, observed 5,474 and 1,850.
Result: chi-square = 0.263, df = 1, p > 0.05.
Interpretation: fail to reject the null hypothesis. The observed data fits the expected 3:1 ratio extremely well. This is why Mendel’s original data has become a textbook example of how well real crosses can match the predicted Mendelian ratio.
Example 2: Perfect 9:3:3:1 Fit
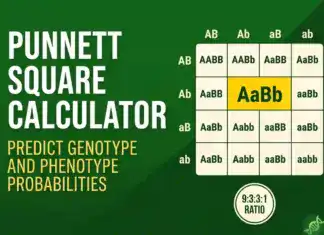
A standard dihybrid F1 x F1 cross (AaBb x AaBb) predicts a 9:3:3:1 phenotypic ratio. In a sample of 160 offspring, the expected counts are 90 A_B_, 30 A_bb, 30 aaB_, and 10 aabb. If a student happens to observe exactly those counts, the chi-square value is 0.
Setup: 4 classes, ratio 9:3:3:1, observed 90, 30, 30, 10.
Result: chi-square = 0, df = 3, p > 0.05.
Interpretation: perfect fit. The data matches the expected ratio exactly. In practice this almost never happens with real offspring, but it is useful as a baseline to see the calculator output.
Example 3: Slight Deviation from 9:3:3:1
A student runs a dihybrid cross and counts 87 A_B_, 31 A_bb, 30 aaB_, and 12 aabb. Total 160. The counts are close to but not exactly the expected 90:30:30:10.
Setup: 4 classes, ratio 9:3:3:1, observed 87, 31, 30, 12.
Result: chi-square = 0.533, df = 3, p > 0.05.
Interpretation: fail to reject the null hypothesis. The data is consistent with a 9:3:3:1 ratio. This is the kind of small deviation that is normal in any real cross, due to sampling variation.
Example 4: Strong Deviation (Possible Epistasis)
A student runs a dihybrid cross expecting 9:3:3:1 but counts 140 A_B_, 30 A_bb, 30 aaB_, and 20 aabb. Total 220. The A_B_ class is over-represented, while aabb is also higher than expected.
Setup: 4 classes, ratio 9:3:3:1, observed 140, 30, 30, 20.
Result: chi-square = 11.11, df = 3, 0.01 < p < 0.05.
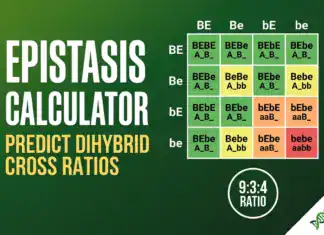
Interpretation: reject the null hypothesis at the 5 percent level. The data does not fit a 9:3:3:1 ratio. This pattern of deviation (one class much higher than expected) is a clue that the inheritance may involve a different mechanism, such as recessive epistasis producing a 9:3:4 ratio instead.
Chi-Square Calculator vs Punnett Square Calculator
A Punnett square calculator and a chi-square test calculator answer different questions. The Punnett square predicts what the offspring ratio should be under a given inheritance model. The chi-square test then checks whether your actual data matches that prediction.
Use a Punnett square first to get the expected ratio. Then collect real offspring data and run a chi-square test to see if the data fits. If the chi-square p-value is greater than 0.05, your inheritance model is probably correct. If the p-value is less than 0.05, the model needs revisiting, perhaps with a different Mendelian ratio (such as 9:3:4 for recessive epistasis) or a non-Mendelian explanation.
Limits of the Chi-Square Test
- Sample size matters. Chi-square requires expected counts of at least 5 per class. Smaller samples can give misleading p-values. If your expected count for any class is below 5, the test may not be reliable.
- Independent observations. The test assumes each offspring is an independent event. Linked genes violate this assumption.
- Only tells you if the model fails. A significant chi-square tells you the expected ratio is wrong, but not which alternative ratio fits better. You may need to test multiple candidate ratios.
- Direction of deviation is not captured. The chi-square value treats over-representation and under-representation the same. A class with 0 observed and 50 expected gives the same chi-square contribution as 100 observed and 50 expected.
- Binomial and multinomial tests are alternatives for very small samples. For typical class sizes (n greater than 20), chi-square is the standard choice.
Related Resources
Punnett Square Calculator

X-Linked Punnett Square Calculator
Epistasis Calculator

Pedigree Analyzer

Genetics Glossary

What Is The Chromosome Theory Of Inheritance?
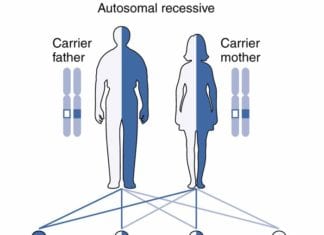
Autosomal Recessive Inheritance: Principles, Patterns, & Associated Disorders

History of Genetics
Frequently Asked Questions
A chi-square test calculator is a genetics statistics tool that takes your observed offspring counts and compares them to the expected counts from a Mendelian ratio. It returns the chi-square value, degrees of freedom, p-value range, critical values, and a plain language interpretation.
First, use a Punnett square to find the expected ratio (for example 9:3:3:1 for a dihybrid cross). Then count your actual offspring. Plug the observed counts and the expected ratio into this chi-square calculator. The calculator computes chi-square as the sum of (observed minus expected) squared, divided by expected, across all classes.
Degrees of freedom in a chi-square goodness of fit test equals the number of phenotype classes minus 1. A monohybrid cross has 2 classes, so df = 1. A standard dihybrid cross has 4 classes, so df = 3. The degrees of freedom determines which critical value table you use.
A p-value greater than 0.05 is the standard threshold for accepting the null hypothesis (the data fits the expected ratio). A p-value between 0.01 and 0.05 shows significant deviation. A p-value below 0.01 shows highly significant deviation, meaning the expected ratio is probably wrong.
Yes. The chi-square goodness of fit test works for any genetic cross where you have observed counts and a hypothesized expected ratio. This includes monohybrid, dihybrid, test crosses, epistasis crosses, incomplete dominance, and codominance. The only requirement is that all expected counts are at least 5 for the test to be reliable.
When any expected count is less than 5, the standard chi-square approximation is unreliable. For small sample sizes, consider a Fisher exact test or a Monte Carlo simulation instead. This calculator flags expected counts below 1 by refusing to calculate (chi-square is undefined when expected is zero), but it does not block the 1 to 4 range, so check your own data before drawing conclusions.
No. This is an educational tool for genetics students and teachers. For clinical statistical analysis, research publications, or any decision with real world consequences, consult a qualified statistician or genetic counselor.
The Chi-Square Test Calculator is part of the BioExplorer suite of free genetics learning tools. It is designed for students working through Mendelian genetics, AP Biology, or introductory college genetics courses, and for teachers preparing examples and problem sets.
The calculator implements the standard chi-square goodness of fit test with critical values for degrees of freedom 1 through 10. It supports any number of phenotype classes from 2 to 5, with both ratio mode and direct expected counts mode. Worked examples include real datasets from Mendel and common textbook problem sets.
Last updated: July 2, 2026
Cite this page
Bio Explorer. (2026, July 3). Chi-Square Calculator. https://www.bioexplorer.net/chi-square-calculator/