
Root:Shoot Ratio Calculator
A root:shoot ratio calculator computes the biomass allocation between belowground and aboveground plant tissue from a single paired observation, an allometric regression across multiple plants, or a control-versus-treated comparison.
The same calculator returns the root mass fraction, the percent of total biomass in each organ, and an interpretation band anchored to published values for ten reference species plus a custom entry.
Root:Shoot Ratio Calculator
Compute plant biomass allocation ratios with interpretation bands anchored to published data for crops, model plants, and trees. Includes single-sample, allometric (3+ paired observations), and two-sample comparison modes.
| # | Root dry mass (g) | Shoot dry mass (g) | Action |
|---|---|---|---|
| 1 | |||
| 2 | |||
| 3 |
How to use the root:shoot ratio calculator
- Pick a species preset from the dropdown (maize, wheat, rice, soybean, tomato, arabidopsis, pinus, eucalyptus, oak, poplar, or custom). The preset supplies the typical R:S range used to color the interpretation band in the chart below the inputs. Pick Custom if your plant is not on the list; the calculator will use a broad generic range as a rough teaching anchor and warn that it is not species-specific.
- Choose a mode tab:
- Single sample: enter the dry mass (or total length) of root and shoot for one plant or pot.
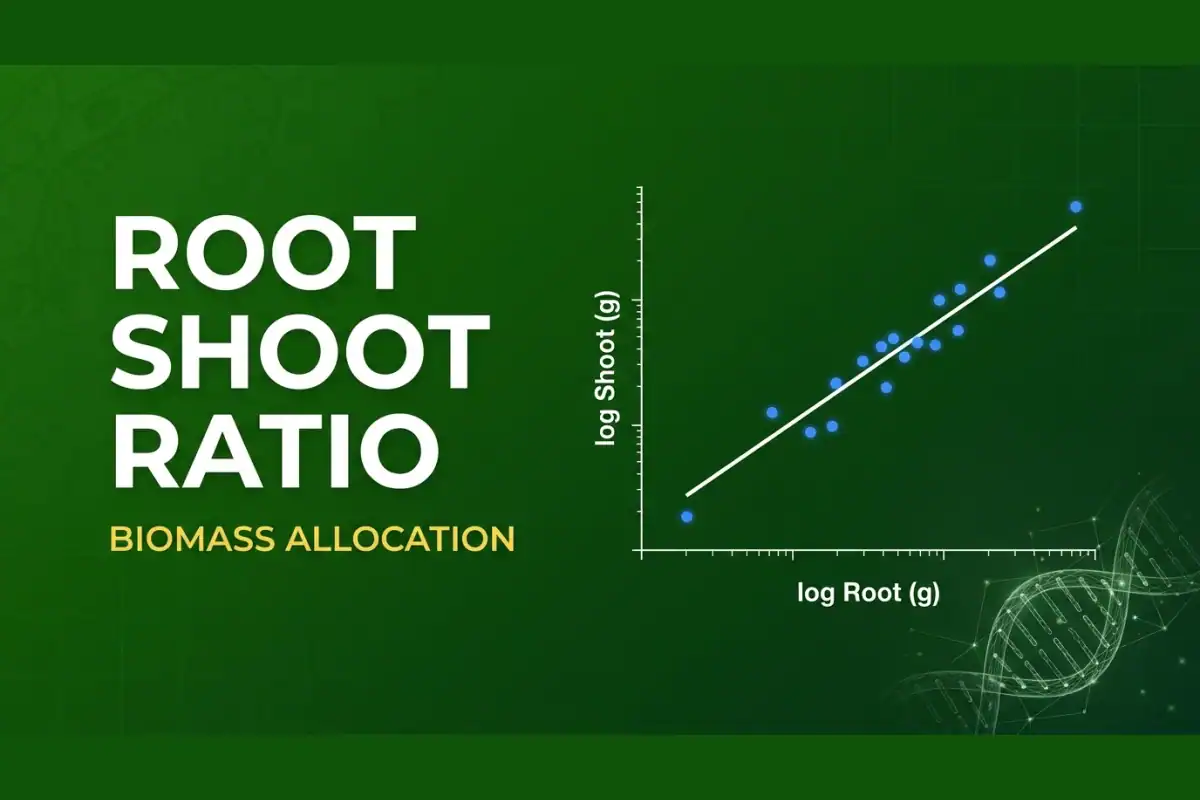
- Allometric (3+ samples): enter at least 3 paired root/shoot observations from a series of plants. The calculator fits the log-log regression log(R) = log(b) + K x log(S) and reports the OLS slope, the signed RMA slope, the allometric constant b, the R-squared of the fit, and a t-test for isometry (K = 1).
- Two-sample comparison: enter the dry mass of root and shoot for a control sample and a treated sample. Pick a stress context from the dropdown (drought mild, drought severe, nitrogen low, phosphorus low, elevated CO2, shade, high light) to interpret the direction and magnitude of the R:S change.
- Click Load worked example to pre-fill the inputs with a published reference dataset, or type your own values directly. Results update as you type.
- Read the interpretation band in the chart. The five zones (very low, low, typical, high, very high) bracket the typical published range for the selected species. The green marker shows where your value lands.
What the root:shoot ratio is and why it matters
The root:shoot ratio (R:S) is the ratio of belowground biomass to aboveground biomass, usually expressed in g/g dry mass. It is one of the most widely reported functional traits in plant ecology, agronomy, and ecophysiology, because it captures how a plant divides resources between acquiring belowground resources (water, nutrients) and aboveground resources (light, CO2).
For a vegetative-stage plant in well-watered, well-fertilized conditions, R:S varies systematically with growth form. Crops and herbaceous species typically fall between 0.10 and 0.40 (so roughly 9-29% of total root-plus-shoot biomass is belowground). Trees and woody perennials often fall between 0.15 and 0.35 as seedlings, then decline as the stem fraction accumulates.
Severe drought, low nitrogen, low phosphorus, elevated CO2, and high light generally push R:S upward because the plant invests relatively more in belowground resource capture. Shade and low light generally push R:S downward because the plant invests relatively more in shoots and leaves. Mild drought can produce little change or even a slight decrease, depending on intensity and crop type.
Two formulations appear in the literature, and the calculator reports both:
- R:S (root:shoot) = root mass / shoot mass. A value of 0.20 means root mass is one-fifth of shoot mass. This is the convention in most agronomy and forestry papers.
- RMF (root mass fraction) = root mass / (root mass + shoot mass). A value of 0.167 (16.7%) means root mass is one-sixth of total biomass. This is the convention in most carbon-allocation and ecosystem models.
Both formulations are mathematically equivalent. A plant with R:S = 0.20 has RMF = 0.167, and a plant with RMF = 0.30 has R:S = 0.429. The conversion is R:S = RMF / (1 – RMF) and RMF = R:S / (1 + R:S). The calculator displays both so you can read off whichever your paper uses.

Carbon Cycle Steps: Overview & Importance in Biosphere
Single-sample mode (one plant or one pot)
Enter the dry mass (in grams) or the total length (in centimeters) of the root system and the shoot system. The calculator returns:
- Root:shoot ratio (R:S) with the units and decimal precision appropriate to your input.
- Root mass fraction (RMF) and shoot mass fraction (SMF) in mass mode, or the corresponding root and shoot length fractions in length mode. The two fractions sum to 1.
- Total biomass (or total length) and the percent of total that is root versus shoot.
- An interpretation badge that places your value into one of five bands: very low, low, typical, high, or very high relative to the published range for the selected species.
The mass mode is the default and is what most papers report. The length mode is a separate calculation: the ratio of total root length to total shoot length. Length-based R:S is not interchangeable with mass-based R:S, and the calculator does not attempt a conversion because the allometric relationship between root length and root mass depends on root diameter and tissue density, which vary by species and treatment.
Allometric mode (3+ paired observations)
When you have root and shoot measurements from a series of plants (typically different sizes from a single treatment or a harvest series), the allometric relationship log10(R) = log10(b) + K x log10(S) captures how the two organs scale with each other. The slope K is the allometric exponent: K = 1 means isometric scaling (R:S stays constant as the plant grows), K > 1 means root scales faster than shoot (R:S increases with size), and K < 1 means shoot scales faster than root (R:S decreases with size).
The calculator reports both the OLS slope (K_OLS) and the signed RMA slope (K_RMA). RMA (reduced major axis, also called standard major axis) regression is the standard in allometric studies because it treats both variables symmetrically and does not assume one is measured without error. The Warton et al. 2006 method for signed RMA is used, which preserves the sign of the correlation (a negative slope is not flipped to its absolute value). For positive correlations, K_RMA = K_OLS / r, where r is the Pearson correlation.
The calculator also reports a t-test for isometry: the null hypothesis is K = 1 (isometric scaling), and the p-value indicates whether the data reject that null at the 5% level. The isometry test is reliable only with at least 5 paired observations; with n = 3 or n = 4, the test is underpowered and the calculator emits a warning. Use the allometric exponent and b constant directly when n is small, and treat the p-value as suggestive only.
Two-sample mode (control versus treatment)
Enter the dry mass of root and shoot for a control plant (or the mean of a control cohort) and a treated plant (or the mean of a treated cohort). The calculator computes R:S for each, then the percent change (delta percent) and the magnitude on a 4-step scale: minor (<15%), moderate (15-30%), large (30-50%), and very large (>50%).
Pick a stress context from the dropdown to interpret the direction of the change against published meta-analysis data:
- Drought (mild, <25% intensity): expected R:S change near zero, sometimes with a slight decrease (Seidel et al. 2024).
- Drought (severe, >50% intensity): expected R:S increase of 30% (Seidel et al. 2024), ranging 13.5-43% depending on crop and tap vs fibrous root system.
- Nitrogen deficiency: expected R:S increase of approximately 44% (Lopez et al. 2023; Seidel et al. 2024). This is one of the largest expected shifts among the common stress treatments.
- Phosphorus deficiency: expected increase in root allocation, with a cited root-length-per-shoot-biomass response of approximately 51% (Lopez et al. 2023). Treat this as a directional guide when you are using mass-based R:S.
- Elevated CO2: expected R:S increase of approximately 12% on average (Seidel et al. 2024). Direction can vary by species and nutrient status, but the calculator’s stress-context preset treats the expected direction as an increase.
- Shade / low light: expected R:S decrease of approximately 20% (Poorter et al. 2012). Plant prioritizes shoot to compete for photons.
- High light: expected R:S increase of approximately 15% (Poorter et al. 2012). Plant increases root investment to balance higher transpiration.
The calculator returns a consistent / inconsistent verdict based on whether the measured direction matches the expected direction and reaches at least half of the expected magnitude. For the mild-drought context, the expected response is no clear change, so values within the tolerance band count as consistent. The verdict is a teaching guide, not a statistical test.
Species presets and where the ranges come from
The interpretation bands are anchored to typical R:S values for vegetative-stage plants in well-watered, well-fertilized conditions, drawn from the calculator’s reference data for each species or species group:
- Maize (Zea mays): 0.10-0.25 (Bolinder et al. 2007; Skinner & Comas 2010). R:S declines with age from V6 to R1.
- Wheat (Triticum aestivum): 0.13-0.27 (USDA-ARS Skinner & Comas 2010; Bolinder et al. 2007). Range varies with growth stage.
- Rice (Oryza sativa): 0.10-0.30 (Katsura et al. 2010; Bueno et al. 2010). Wide range because of strong variety differences.
- Soybean (Glycine max): 0.09-0.26 (agricultural reference data). Range varies by stage, cultivar, and nodulation status.
- Tomato (Solanum lycopersicum): 0.10-0.30 (Poorter et al. 2015; Solanaceae allocation data). Range varies by cultivar and growth system.
- Arabidopsis thaliana: 0.20-0.45 (Poorter et al. 2015). Small herbaceous model plants can show relatively high R:S early in development.
- Pinus radiata: 0.13-0.24 (Scion Research / BEETS report). Mean root:shoot ratio is approximately 0.19 in the cited report.
- Eucalyptus spp.: 0.15-0.25 (Harris 1992 tree review). Use as a broad tree anchor unless you have species-specific data.
- Quercus spp.: 0.18-0.30 (Harris 1992; Poorter et al. 2012). Range varies with seedling age and site conditions.
- Populus spp.: 0.20-0.35 (Harris 1992; Poorter et al. 2012). Range varies with clone, growth rate, and water status.
The Custom preset uses a broad generic range (0.10-0.40) when no species-specific data is available. The calculator emits a warning that the range is not species-specific, and you should interpret the band as a rough anchor only.
Methodology and assumptions
Mass versus length: The calculator supports both. The mass-based R:S is the default and is what most papers report. The length-based R:S is reported separately and is not directly comparable to the mass-based value. If your paper uses length, report length; if it uses mass, report mass.
Destructive harvest: R:S is computed from destructive harvest data. Non-destructive estimates (e.g. minirhizotron observations, image-based root length) introduce their own measurement errors and may not match the R:S ranges reported in this calculator, which are based on dry mass from full root excavations.
Fine root recovery: A zero root value with a positive shoot value is treated as a warning, not an error, because the most common cause is incomplete fine root recovery. PROMETHEUS protocols (PrometheusWiki 2008) and the Harris 1992 tree review both note that fine roots (<2 mm diameter) are systematically under-collected in screen and hydropneumatic elutriator systems. Use the warning as a prompt to recheck the harvest, not as a flag to discard the measurement.
Allometric assumptions: The log-log regression assumes that root and shoot scale as a power law across the range of sizes measured. This holds reasonably well for plants sampled from a single cohort under a single treatment, but breaks down if the plants span a developmental transition (e.g. vegetative to reproductive) or if the size range is very narrow. A low R-squared (below 0.90) is a signal that the power-law assumption is violated.
Two-sample interpretation: The consistent / inconsistent verdict compares the measured delta to the published expected delta in both direction and magnitude. For stress contexts with a positive or negative expected shift, the measured change must match the expected direction and reach at least half of the expected magnitude. For mild drought, values inside the no-clear-change tolerance band count as consistent. The verdict is a teaching guide, not a statistical test: a true comparison of treatments requires replicates and an ANOVA or equivalent test, which is beyond the scope of this single-calculator tool.
When to use this calculator
- Plant biology courses: teaching the concept of biomass allocation, the allometric scaling law, and the effect of stress on resource partitioning.
- Agronomy research: characterizing cultivar differences in root investment, comparing fertilization treatments, or screening germplasm for drought-tolerant root systems.
- Ecophysiology field work: comparing populations across environmental gradients, classifying species along the acquisitive-conservative spectrum, or testing stress response predictions.
- Forestry and tree crop work: characterizing seedling quality, comparing provenances, or tracking allocation shifts with stand age.
- Carbon modeling: estimating root biomass from shoot biomass via an allometric equation, or parameterizing belowground allocation fractions in ecosystem models.
Related resources
- The Specific Leaf Area Calculator covers a related leaf-level trait: leaf area per unit leaf dry mass, used to classify species along the leaf economics spectrum.
- For seed quality work, the Seed Germination Calculator computes viability from a single count, and the Germination Rate Calculator tracks germination kinetics over a daily time series.
- Browse the full Botany Tools collection, or see the complete Biology Tools and Calculators hub for tools across genetics, cell biology, and botany.
Frequently asked questions
The root:shoot ratio (R:S) is the ratio of belowground biomass to aboveground biomass, expressed in grams of dry mass per gram of dry mass. A value of 0.20 means root mass is one-fifth of shoot mass. A related metric, the root mass fraction (RMF), is root mass divided by total plant mass; RMF is the convention in carbon-allocation models. The two are mathematically related: R:S = RMF / (1 – RMF) and RMF = R:S / (1 + R:S).
For vegetative-stage crops in well-watered, well-fertilized conditions, R:S often falls between 0.10 and 0.30, but the species preset determines the calculator band. Maize is 0.10-0.25, wheat is 0.13-0.27, rice is 0.10-0.30, and soybean is 0.09-0.26. R:S declines with age as the plant shifts investment from root to shoot and reproductive structures, so the same plant at V6 can have a higher R:S than at R1.
For tree seedlings in well-watered, well-fertilized conditions, R:S often falls between 0.15 and 0.35, but the calculator presets are species-group anchors. Pinus radiata is 0.13-0.24, eucalyptus is 0.15-0.25, oak (Quercus) is 0.18-0.30, and poplar is 0.20-0.35. R:S generally declines as trees mature because the stem fraction accumulates faster than the root fraction.
Drought response depends on intensity. Mild drought below about 25% intensity can produce little change or a slight decrease in R:S, while severe drought above about 50% intensity generally increases R:S. Seidel et al. 2024 reported severe-drought increases around 30%, with a range of about 13.5-43% depending on crop and root system type.
Nitrogen deficiency usually increases R:S because the plant shifts allocation toward roots when nitrogen limits aboveground growth. The calculator uses an expected increase of about 44% from the cited meta-analysis values, but the exact response varies with species, stage, and treatment severity.
The allometric exponent K is the slope of the log-log regression log(R) = log(b) + K x log(S) fitted across multiple plants. K = 1 means isometric scaling: R:S is constant as plants grow larger. K > 1 means root scales faster than shoot: R:S increases with plant size. K < 1 means shoot scales faster than root: R:S decreases with plant size. The calculator reports both the OLS slope (K_OLS) and the signed RMA slope (K_RMA). RMA is commonly used in allometric studies because it treats both variables symmetrically.
At least 3 paired observations are required to fit the log-log regression (the regression has 2 parameters: K and b). The calculator labels the isometry t-test as underpowered with n = 3 or n = 4, because very small samples give unstable p-values. Use the K and b values directly when n is small and treat the p-value as suggestive only.
Yes. The mass-based calculation works the same way regardless of growth system. The interpretation bands are broad anchors from soil-grown and general reference data, so hydroponic and aeroponic plants should be interpreted cautiously if the root environment strongly changes allocation. If the hydroponic system imposes a specific stress, use the two-sample mode with the appropriate stress context.
Root mass and root length are different measurements that cannot be converted without additional information (root diameter and tissue density). The calculator supports both but does not attempt a conversion. A plant with high root length but low root mass has a fine, fibrous root system with many thin roots. A plant with low root length but high root mass has a coarse, thick-rooted system. Most papers report root mass; report mass if your paper uses mass.
The BioExplorer Root:Shoot Ratio Calculator is a free educational tool for plant biomass allocation math. It supports three modes: single-sample (one plant or pot), allometric (3+ paired observations fitted as a log-log regression), and two-sample comparison (control versus treated) with stress interpretation. Ten species presets supply typical R:S ranges drawn from reference literature; a custom preset falls back to a broad generic range with a warning that the band is not species-specific. The allometric mode reports OLS and signed RMA slopes (Warton et al. 2006), the allometric constant b, R-squared, and a t-test for isometry. The two-sample mode reports direction, magnitude, and a consistent / inconsistent verdict against published meta-analysis effect sizes for seven stress contexts. All math runs in the browser; no data is sent to a server.
The interpretation bands are broad teaching guides, not universal species-specific cutoffs. For cultivar-level comparisons, replicate at least 4-6 plants per treatment and report the mean and standard error. For statistical comparison of treatments, run a one-way ANOVA or a mixed-effects model on the replicate-level data, which is beyond the scope of a single-calculator tool. The calculator helps you read published values, classify your measurement against a species baseline, and quantify the effect of a single stress treatment. It does not replace a proper experimental design with replication and variance estimation.
References: Poorter et al. 2012, Warton et al. 2006, PrometheusWiki root mass fraction, Seidel et al. 2024, Lopez et al. 2023, Bolinder et al. 2007, Skinner & Comas 2010,Katsura et al. 2010,Bueno et al. 2010,Poorter et al. 2015
Cite this page
BioExplorer. (2026, September 30). Root:Shoot Ratio Calculator. https://www.bioexplorer.net/root-shoot-ratio-calculator/