
Seed Germination Calculator
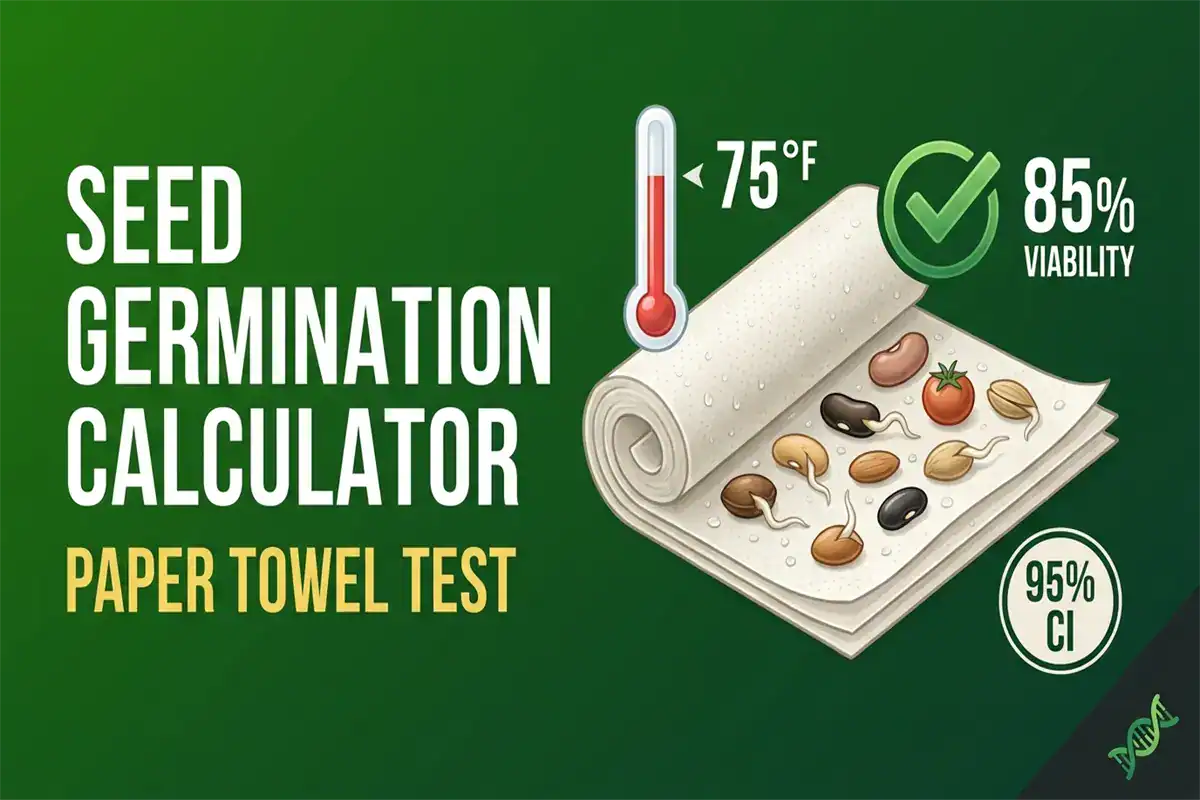
A seed germination calculator turns a simple paper towel trial into a germination rate, a confidence interval, a planting quantity, and a species-typical days-to-sprout estimate. The same tool helps answer two common home-garden questions: how to test seed germination at home, and whether stored seed from a previous season is still worth planting.
Seed Germination Calculator
Run a paper-towel trial, get the viability rate with confidence interval, and see how many seeds to plant for your target count. Includes species-specific days and temperature plus a storage-adjusted viability estimate.
How to run a paper-towel germination test
- Count 10 to 100 seeds from the packet. More seeds means a tighter confidence interval.
- Spread them on a damp paper towel. Fold the towel. Place in a sealed plastic bag.
- Store in a warm spot at the species’ optimal temperature. Check moisture every 2 days.
- After the species-specific test window, count the seeds with healthy shoots and roots. Many vegetables finish in 7 to 14 days, while slower herbs may take 21 to 28 days.
- Enter n (seeds tested) and m (seeds sprouted) below. The tool computes the rest.
Inputs
Results
Storage-adjusted expected viability
Baseline expected viability declines with storage time. Harrington’s temperature thumb rule says each roughly 5°C drop in storage temperature can about double seed life under dry conditions. The estimate below combines the species baseline half-life with the storage profile you selected.
How to use the Seed Germination Calculator
- Pick the species you are testing from the dropdown. The list covers 30 common home-garden vegetables, herbs, flowers, and model plants.
- Enter the number of seeds you placed in the paper towel germination test under Number tested (n).
- Enter the number of those seeds that developed normal seedlings under Number germinated (m).
- Enter the number of established plants you want from this packet. Adjust the safety buffer slider for losses between germination and transplanting.
- Read the output. The germination rate, confidence interval, quality rating, days, storage estimate, and sowing tip update as you type.
Germination Rate Calculator
How to read the results
- The germination rate is the number of normal seedlings divided by the number of seeds tested, then multiplied by 100.
- The 95 percent confidence interval is an estimated range for the true germination rate of the seed lot. A confidence interval does not guarantee that this particular lot’s true rate is inside the interval; it describes how the method behaves across repeated samples.
- The quality rating compares the tested rate with the species benchmark used by the calculator. It is a planning label, not an official AOSA or ISTA certification.
- The days to germinate range comes from the species database. Actual timing changes with temperature, moisture, seed age, cultivar, and dormancy.
- The optimal soil temperature range is the band where the selected species usually germinates quickly and uniformly. Warm-season crops generally need warmer soil than cool-season crops.
- The sowing tip uses the species light requirement to suggest whether to surface-sow or cover the seed lightly.
- The storage-adjusted viability estimates how much of the species baseline viability might remain after the selected storage conditions.
How the seed germination calculator works
The seed germination percentage is the simple proportion of normal seedlings out of seeds tested:
g = m / n
where m is the number of seeds that developed normal seedlings and n is the total number of seeds placed in the trial. Official seed tests distinguish normal seedlings from abnormal seedlings, dead seeds, hard seeds, and dormant seeds. This home calculator uses the normal-seedling count as the practical input because it is the category that matters most for garden establishment.
The default 95 percent confidence interval is the normal approximation interval:
CI = g ± 1.96 × √(g(1 - g) / n)
The normal approximation is most useful when both n × g and n × (1 – g) are at least 5. When the sample is small or the result is near 0 percent or 100 percent, the normal interval can be misleading. The tool flags those cases and offers the Wilson score interval, a standard binomial-proportion interval that behaves better near the boundaries.
Quality rating is a practical planning label. The tool compares the tested germination rate with the species benchmark in its database: at or above the species benchmark earns Excellent, 80 percent to the benchmark earns Good, 60 to 80 percent earns Marginal, and below 60 percent earns Poor. These labels are useful for home-garden decisions, but they do not replace official seed-labeling rules or certified laboratory testing.
How many seeds to plant for a target plant count uses straightforward arithmetic. The tool divides the target plant count by the tested germination rate and then multiplies by the safety buffer:
seeds = ⌈(target / g) × (1 + buffer / 100)⌉
The result is rounded up to whole seeds. The default 10 percent buffer is a practical cushion for home seed starting. Use a larger buffer when you expect extra losses from cold soil, transplant shock, pests, or uneven moisture.
Seed storage longevity and the storage viability adjustment
Seed viability declines with storage time. The decline is strongly affected by temperature, moisture, species, seed maturity, packaging, and initial seed quality. General seed-storage guidance, including Harrington’s Thumb Rules, emphasizes that cooler and drier storage usually extends the life of orthodox seeds. Seed-bank models such as the Ellis and Roberts viability equations describe the same broad temperature-and-moisture problem with more formal mathematics, but they require inputs that most home gardeners do not have.
This seed planting calculator covers five practical home storage profiles: freezer, sealed refrigerator, cool dry room, room temperature, and warm garage or shed. The tool’s species database carries a rough baseline half-life in years under cool dry room conditions. Half-life means the time for the expected viable fraction to fall to half its starting value under the model. The selected storage profile changes that half-life, and retention is computed with exponential decay:
retention = 0.5 ^ (years / adjusted_half_life)
The storage-adjusted viability is the species baseline viability multiplied by that retention. For example, in the calculator’s simplified model, a tomato seed lot stored sealed in a refrigerator for three years has an adjusted half-life of 16 years. Its retention is about 88 percent, so the storage-adjusted viability is about 75 percent when the tomato baseline is 85 percent. The same tomato lot stored for five years in a warm garage has a much lower modeled retention, leaving the storage-adjusted viability near 15 percent.
The storage panel is most useful for three questions: Are saved seeds from last season still viable? Is a five-year-old packet still worth testing? Should I buy fresh seed or sow more heavily from what I have?
Worked examples
Example 1: Running a seed viability test on a saved tomato lot
Setup: A seed viability test on 20 saved tomato seeds produced 17 normal seedlings after 9 days at 75 degrees Fahrenheit in a sealed plastic bag.
Inputs: species Tomato, Number tested (n) 20, Number germinated (m) 17, target plants 20, safety buffer 10 percent, storage profile fridge sealed, storage years 0.
Results: germination rate 85 percent. The normal approximation interval is 69.4 to 100 percent after clamping to valid percentage bounds, but it is flagged because n × (1 – g) is only 3. The Wilson score interval is 64.0 to 94.8 percent. Quality rating Excellent because 85 percent matches the tomato benchmark used by the calculator. Seeds needed for 20 plants at a 10 percent buffer: 26. Sowing tip: cover lightly with about 1/4 inch of soil. Storage-adjusted viability: 85 percent for a fresh lot.
Discussion: The intervals differ because 20 seeds is a small sample and only three seeds failed. A larger trial, such as 50 or 100 seeds, would tighten the estimate. For a home-garden decision, the saved tomato lot is still worth planting.
Example 2: Year-old lettuce packet stored in the fridge
Setup: 10 lettuce seeds from a year-old opened packet produced 6 normal seedlings at 65 degrees Fahrenheit after 8 days. Storage profile: fridge sealed for 1 year.
Inputs: species Lettuce, n 10, m 6, target plants 15, buffer 10 percent, fridge sealed, 1 year.
Results: germination rate 60 percent. The normal approximation interval is 29.6 to 90.4 percent and is flagged because the sample is small. The Wilson score interval is 31.3 to 83.2 percent. Quality rating Marginal because 60 percent is below the lettuce benchmark used by the calculator. Seeds needed: 28. Sowing tip: press seeds onto the soil surface because lettuce often germinates better with light. Storage-adjusted viability: about 75 percent.
Discussion: The tested rate sits below the storage-adjusted estimate. Possible reasons include warm or humid storage, an opened packet that was not truly airtight, a low-quality starting lot, or ordinary sampling variation from testing only 10 seeds.
Example 3: Brand-new carrot packet for a 200-plant garden
Setup: 100 carrot seeds from a freshly opened 2026 packet produced 65 normal seedlings at 70 degrees Fahrenheit in 12 days. Storage profile: cool dry room, 0 years.
Inputs: species Carrot, n 100, m 65, target plants 200, buffer 15 percent, cool dry room, 0 years.
Results: germination rate 65 percent. The normal approximation interval is 55.7 to 74.3 percent. The Wilson score interval is 55.3 to 73.6 percent, so the two methods agree closely at this sample size. Quality rating Marginal by the calculator’s 60-to-80 percent category, although it is above the carrot benchmark. Seeds needed: 354. Storage-adjusted viability: 60 percent for the carrot baseline.
Discussion: With n = 100, the estimate is much more useful than a 10-seed trial. Tested viability is slightly above the calculator’s carrot baseline. For a larger planting, multiply the target count by the same viability-and-buffer formula, then confirm with a larger or certified test if the seed lot is expensive.
Limits and assumptions
The seed germination calculator is an educational estimate, not a certified seed test. Real-world seed testing carries caveats the tool cannot capture.
- A paper towel germination test uses a small sample. Official seed-lab tests use controlled conditions, species-specific rules, and larger sample sizes, often 200 or 400 seeds depending on the crop and rule set.
- The seed germination percentage depends on uniform conditions. Cold spots, dried towels, excess water, mold, or seed damage can underestimate the true germination potential.
- The simple proportion g = m / n treats every normal seedling as equal. Certified tests separate normal seedlings, abnormal seedlings, hard seeds, fresh ungerminated seeds, and dead seeds.
- The storage math is a rough model. It is most defensible for orthodox seeds stored within ordinary home-storage temperatures. It is not a substitute for Ellis-Roberts seed-bank modeling or a fresh germination test.
- The species database covers common home-garden crops and model plants. Specialty crops, regional landraces, dormant seed, and freshly harvested seed can fall outside these baseline values.
- The Wilson toggle shows an alternate binomial confidence interval for small samples. Both intervals are estimates, and both depend on a representative sample and a correctly run germination test.
Related Botany Resources on BioExplorer
The BioExplorer site carries a broad library of botany content alongside this calculator. The resources below cover plant physiology, horticultural practice, and the historical context of seed science.









Frequently Asked Questions
A count of 20 seeds is a practical minimum for home gardeners, but it still gives a wide confidence interval. Testing 50 to 100 seeds gives a more useful estimate when you have enough seed to spare. Official laboratory tests commonly use larger samples under controlled conditions, so a home paper towel test should be treated as a planning estimate rather than a certified result.
A 95 percent confidence interval describes the long-run behavior of the estimation method. If the same kind of seed lot were sampled many times under the same assumptions, about 95 percent of the intervals would contain the true germination rate. For example, 17 seeds sprouted out of 20 gives an 85 percent point estimate, but the normal approximation is flagged because the sample has only three failures. The Wilson score interval is usually more useful for that small-sample case.
A result below 60 percent is a warning sign for most home-garden uses, but it is not an automatic discard rule. Retest valuable, rare, heirloom, or specialty seed before throwing it away because small samples can be noisy. Low-germination seed may still be usable if you sow more heavily, but fresh seed is usually the lower-risk choice for important plantings.
Yes. Most vegetable seeds have a preferred soil-temperature range, and the calculator shows that range for the selected species in Fahrenheit and Celsius. Cooler-than-optimal temperatures usually slow germination. Excessively high temperatures can reduce germination or damage seedlings, depending on the species.
Storage viability depends on temperature, moisture, species, seed maturity, packaging, and initial seed quality. Cool, dry, airtight storage usually extends seed life. Onion, parsnip, parsley, and some herb seeds often lose viability faster than tomato or many cucurbit seeds. The calculator’s storage panel is a rough estimate, so the best answer for an older packet is still to run a fresh germination test.
The paper towel test estimates the actual germination rate right now. The storage-adjusted estimate predicts what might remain from the species baseline after the selected storage time and temperature profile. If the tested rate falls well below the storage estimate, possible causes include moisture, warmer-than-assumed storage, a weak starting lot, or ordinary sampling variation.
About the Seed Germination Calculator
This seed germination calculator was built for home gardeners, seed savers, and biology students who want a quick viability estimate without sending seeds to a lab. The germination-rate math uses a binomial proportion, the default confidence interval is the normal approximation, and the optional Wilson score interval follows Wilson’s 1927 binomial-proportion method. The storage panel is a simplified home-garden model based on the general seed-storage principle that cool, dry conditions preserve orthodox seeds better than warm or humid conditions.
The tool is for educational estimation only. Run a fresh germination test before important plantings, and use a full AOSA or ISTA laboratory test when a seed lot represents a major financial or research decision.
References: