
Germination Rate Calculator
A germination rate calculator computes the main kinetics metrics used in seed-testing datasets: germination percentage with a Wilson confidence interval, mean germination time (MGT), T50, Timson index, coefficient of velocity (CV), and mean daily germination.
The same botany calculator fits Gompertz and logistic curves to the cumulative germination series and reports the lower-RMSE fit. Twelve species presets provide reference MGT and T50 values for comparison with experimental data.
Germination Rate Calculator
| Time | Count | Action |
|---|
How to use the germination rate calculator
- Select a species preset from the dropdown. The preset pre-loads the typical MGT, T50, and optimum germination temperature for that species.
- Choose the count mode (daily or cumulative) and time unit (days or hours) to match how your raw data was recorded.
- Enter the total seeds tested (N) and add rows to the time series table for each observation. The table accepts daily counts (number of seeds germinated in that interval) or cumulative counts (total germinated up to that point).
- Use the Load example buttons to populate the calculator with worked-example data for lettuce, tomato, or a stressed Arabidopsis test, then compare the outputs to your own measurements.
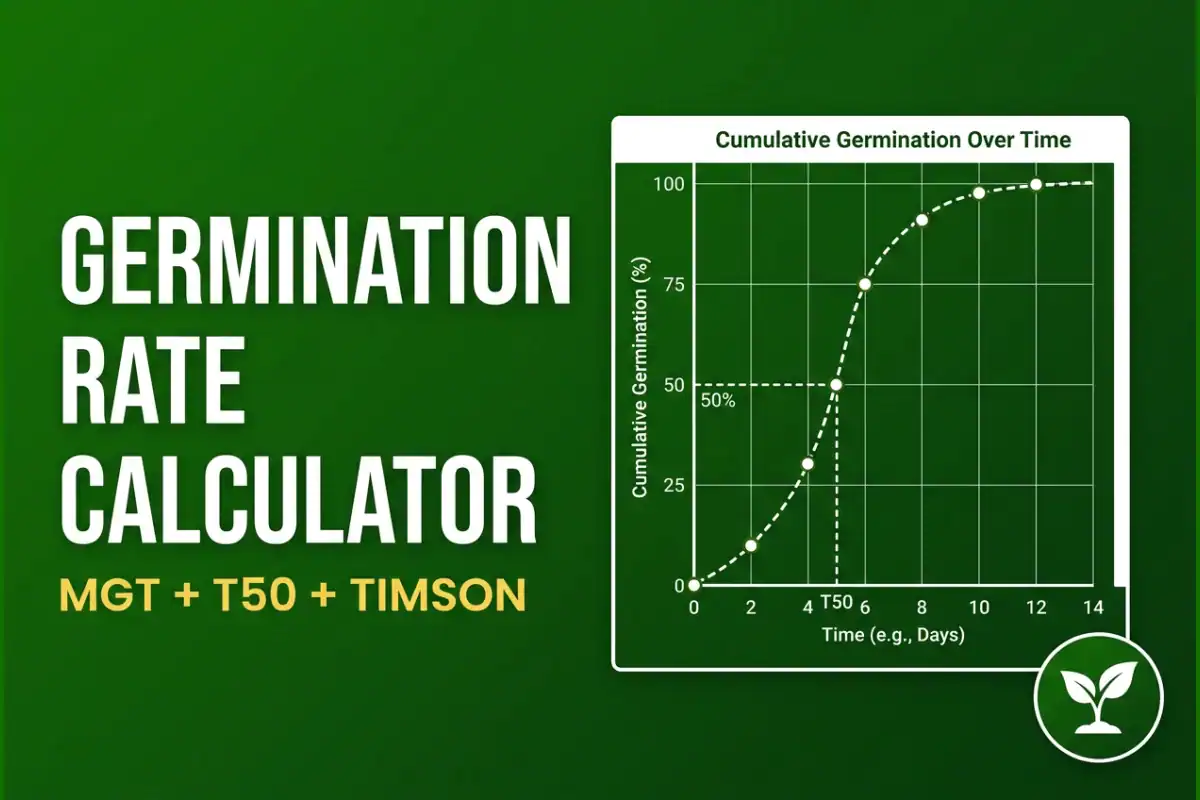
- Read the stat cards for germination percentage with confidence interval, MGT, T50, CV, Timson index, and mean daily germination. The germination curve plot below shows your data points, the best-fit sigmoid, and the T50 marker.
Background: how germination tests work
A standard germination test counts how many seeds produce normal seedlings over a fixed period under controlled conditions. AOSA and ISTA publish official seed-testing rules, including species-specific substrates, temperatures, count schedules, and test durations. In research datasets, the output is usually a time series of newly germinated or cumulative germinated seeds that can be summarized in several ways.
Germination percentage (GP) is the simplest metric: total seeds germinated divided by total seeds tested, expressed as a percentage. The Wilson score confidence interval at 95 percent gives the statistical uncertainty around that percentage. Commercial acceptance thresholds are species- and rule-dependent, so the calculator treats 60, 80, and 90 percent as educational interpretation bands rather than universal sale standards.
Kinetics metrics add the time dimension. Mean germination time (MGT) is the time-weighted average of germination events: lower MGT means faster average germination. In this calculator, T50 is the time at which 50 percent of the total seeds tested have germinated; if final germination never reaches 50 percent, T50 is undefined. The Timson index and coefficient of velocity (CV) summarize germination speed in complementary ways.
Key facts about germination kinetics
- Germination percentage is the proportion of tested seeds that germinated by the final observation. Interpretation thresholds vary by species and standard, so percentage bands should be treated as guidance, not universal grading rules.
- Mean germination time (MGT) is computed as the time-weighted average of germination events. MGT is sensitive to late-germinating outliers: a few seeds germinating at day 14 pull MGT up significantly.
- T50 is the time at which 50 percent of the total seeds tested have germinated in this calculator. It is computed by linear interpolation between the bracketing time points and is undefined when final germination remains below 50 percent.
- Coefficient of velocity (CV) is 100 divided by MGT. Higher CV means faster germination. CV is the inverse of MGT expressed as percentage per day.
- Timson index is computed as the sum of cumulative germination proportions across observation times. Higher Timson values mean faster and more complete germination over the recorded test window.
- Germination curves are often sigmoidal under controlled conditions. The calculator fits both Gompertz and logistic curves when enough monotonic time-series data are available and reports the lower-RMSE fit.
- Seed-testing thresholds vary by species, jurisdiction, and testing rule. Use the calculator bands as educational flags, and use the current AOSA or ISTA rules for official seed-lot decisions.
How the germination rate calculator works
The calculator takes four inputs: total seeds tested (N), the count mode (daily or cumulative), the time unit (days or hours), and the time series of observations. Each observation is a pair (time, count). The calculator applies the standard kinetics formulas:
Germination percentage GP = (Gfinal / N) × 100, where Gfinal is the cumulative number germinated at the final observation.
Mean germination time MGT = Σ(ni × ti) / Σni, where ni is the newly germinated count at observation i and ti is the observation time. The calculator accepts both daily and cumulative inputs and converts cumulative data internally.
T50 is the time at which 50 percent of the total seeds tested have germinated, computed by linear interpolation between the two bracketing observation time points. If the final germination percentage is below 50 percent, T50 is not defined.
Timson index = Σ(Gt / N) across observation times, where Gt is cumulative germination at time t. Higher values mean faster and more complete germination over the recorded test window.
Coefficient of velocity = 100 / MGT, expressed as percent per day when time is entered in days.
Sigmoid curve fit: the calculator fits both a Gompertz curve (G(t) = a × exp(-exp(-(t – t0) / b))) and a logistic curve (G(t) = a / (1 + exp(-(t – t0) / b))) using analytical linearization. The lower-RMSE fit is shown as the primary curve. The plotted T50 marker comes from the linear interpolation calculation above, not from the fitted curve parameter.
Wilson score 95 percent confidence interval on the final germination percentage, accounting for the finite sample size of the test.
Worked example 1: lettuce paper towel test (fast germination)
Lettuce (Lactuca sativa) seeds are tested on a moist paper towel at 20 degrees C, with daily counts for 7 days. Total seeds: 50. Daily germinated counts: 5, 8, 12, 10, 6, 3, 2.
Setup
N = 50. Daily counts at days 1 through 7 as listed above. Cumulative germination: 5, 13, 25, 35, 41, 44, 46.
Calculation
GP at day 7 = 46 / 50 × 100 = 92.0 percent. Wilson 95 percent CI: 81.2 percent to 96.8 percent.
MGT = (1 × 5 + 2 × 8 + 3 × 12 + 4 × 10 + 5 × 6 + 6 × 3 + 7 × 2) / (5 + 8 + 12 + 10 + 6 + 3 + 2) = 159 / 46 = 3.46 days.
T50: 50 percent of 50 seeds = 25 seeds. The cumulative count reaches 25 on day 3, so T50 = 3.00 days.
CV = 100 / 3.46 = 28.9 percent per day. Timson index = 0.10 + 0.26 + 0.50 + 0.70 + 0.82 + 0.88 + 0.92 = 4.18.
Results
The germination percentage of 92 percent is strong for a classroom or research seed test. The MGT of 3.46 days is in the lettuce reference range at 20 degrees C, and the T50 of 3.00 days indicates that half of all tested seeds had germinated by day 3. This is a high-viability, fast-germinating seed lot under these test conditions.
Worked example 2: Arabidopsis at suboptimal temperature (slow germination)
Arabidopsis (Arabidopsis thaliana) seeds are tested on agar plates at 14 degrees C (below the 20 to 25 degree C optimum) with daily counts for 10 days. Total seeds: 50. Daily germinated counts: 0, 0, 1, 2, 3, 5, 8, 6, 3, 2.
Setup
N = 50. Daily counts at days 1 through 10 as listed. Cumulative germination: 0, 0, 1, 3, 6, 11, 19, 25, 28, 30.
Calculation
GP at day 10 = 30 / 50 × 100 = 60.0 percent. Wilson 95 percent CI: 46.2 percent to 72.4 percent.
MGT = (3 × 1 + 4 × 2 + 5 × 3 + 6 × 5 + 7 × 8 + 8 × 6 + 9 × 3 + 10 × 2) / (1 + 2 + 3 + 5 + 8 + 6 + 3 + 2) = 207 / 30 = 6.90 days.
T50: 50 percent of 50 seeds = 25 seeds. The cumulative count reaches 25 on day 8, so T50 = 8.00 days.
CV = 100 / 6.90 = 14.5 percent per day. Timson index = 0.00 + 0.00 + 0.02 + 0.06 + 0.12 + 0.22 + 0.38 + 0.50 + 0.56 + 0.60 = 2.46.
Results
The germination percentage of 60 percent is low compared with the lettuce and tomato examples, but it still provides enough germination to compute kinetics. The MGT of 6.90 days is much slower than the Arabidopsis reference value, indicating that the suboptimal temperature delayed germination. The T50 of 8.00 days confirms the delay. This example shows how kinetics can distinguish slow germination from complete failure to germinate.
Worked example 3: tomato (excellent germination)
Tomato (Solanum lycopersicum) seeds are tested at 25 degrees C with daily counts for 7 days. Total seeds: 100. Daily germinated counts: 40, 30, 15, 8, 3, 2, 1.
Setup
N = 100. Cumulative germination: 40, 70, 85, 93, 96, 98, 99.
Calculation
GP at day 7 = 99 / 100 × 100 = 99.0 percent. Wilson 95 percent CI: 94.6 percent to 99.8 percent.
MGT = (1 × 40 + 2 × 30 + 3 × 15 + 4 × 8 + 5 × 3 + 6 × 2 + 7 × 1) / 99 = 211 / 99 = 2.13 days.
T50: 50 percent of 100 seeds = 50 seeds, reached between day 1 (cumulative 40) and day 2 (cumulative 70). T50 = 1 + (50 – 40) / (70 – 40) × (2 – 1) = 1.33 days.
CV = 100 / 2.13 = 46.9 percent per day. Timson index = 0.40 + 0.70 + 0.85 + 0.93 + 0.96 + 0.98 + 0.99 = 5.81.
Results
The germination percentage of 99 percent is excellent. The MGT of 2.13 days is much faster than the tomato typical of 6 days, and the T50 of 1.33 days means half the seeds germinated in just over a day. This is a high-viability, high-vigor seed lot.
Species preset reference
The calculator’s preset dropdown pre-loads reference MGT and T50 values for common species under typical controlled germination conditions. The interpretation bands compare your measured MGT and T50 to these reference values, but real results vary with cultivar, seed lot age, dormancy, substrate, temperature, and light conditions.
- Lettuce (Lactuca sativa): MGT about 4 days at 15 to 20 degrees C. Fast germination; standard paper towel test 7 days.
- Tomato (Solanum lycopersicum): MGT about 6 days at 25 to 30 degrees C. Standard paper towel test 14 days.
- Arabidopsis (Arabidopsis thaliana): MGT about 3 days at 20 to 25 degrees C. Common agar plate test 7 to 10 days.
- Wheat (Triticum aestivum): MGT about 4 days at 15 to 25 degrees C. Standard between paper (BP) test 8 days.
- Rice (Oryza sativa): MGT about 4.5 days at 25 to 35 degrees C. Higher temperature optimum than most temperate cereals.
- Maize (Zea mays): MGT about 4.5 days at 20 to 30 degrees C. Standard paper towel test 7 days.
- Soybean (Glycine max): MGT about 4.5 days at 22 to 30 degrees C. Standard paper towel (BP) test 8 days.
- Cucumber (Cucumis sativus): MGT about 5 days at 20 to 30 degrees C. Standard paper towel test 7 days.
- Pepper (Capsicum annuum): MGT about 8 days at 25 to 30 degrees C. Slower germinator than tomato.
- Onion (Allium cepa): MGT about 8 days at 18 to 25 degrees C. Slow germinator.
- Carrot (Daucus carota): MGT about 9 days at 18 to 25 degrees C. Slowest in the preset list.
- Bean (Phaseolus vulgaris): MGT about 4.5 days at 18 to 27 degrees C. Standard paper towel test 7 to 9 days.
For a species not in the preset list, select Custom at the top of the dropdown. Custom presets do not enable interpretation bands; the MGT and T50 are reported without comparison to a typical range.
Daily vs cumulative counts
The calculator accepts both daily counts (number of seeds germinated in each interval) and cumulative counts (total germinated up to that point). Some published papers report daily counts explicitly; others report cumulative counts. The two formats are interconvertible but give different numerical values for the same experiment.
For a 7-day lettuce test with daily counts 5, 8, 12, 10, 6, 3, 2, the cumulative counts are 5, 13, 25, 35, 41, 44, 46. Same data, two representations. The calculator converts internally, so the MGT, T50, and other metrics are identical regardless of which format you enter.
The default mode is daily because it is what most published germination studies report. If your lab notebook shows running totals, switch to cumulative. The calculator auto-detects which mode is likely based on monotonicity (cumulative counts should never decrease) and warns if a cumulative input decreases.
Common pitfalls in germination test analysis
- Mixing daily and cumulative counts. If you enter cumulative values but set the count mode to daily, MGT and T50 will be wrong by an order of magnitude. The calculator auto-detects and warns, but verify the count mode matches your raw data.
- Wrong time unit. Typing “7” for a 7-day experiment in an hours-only calculation gives a T50 24 times too small. Use the time unit toggle to switch between days and hours.
- Including the t=0 measurement. If you count seeds immediately after sowing, zero seeds have germinated, which pulls MGT down. Skip the t=0 point or include it only if your germination test protocol specifies it.
- Counting imbibed seeds as germinated. For research kinetics, many protocols count visible radicle emergence; official seed tests usually focus on normal seedling development under species-specific rules. Seeds that only imbibe water should not be counted as germinated. If your protocol uses a different criterion, such as a 2 mm radicle or coleoptile emergence, apply it consistently and note it in your data.
- Not accounting for dormant seeds. Some species have dormant seed fractions that germinate only after stratification or chemical treatment. A 60 percent GP at 14 days may rise to 90 percent after 30 days with gibberellic acid treatment.
- Single replicate. The Wilson confidence interval assumes binomial variance within a single test. For comparing treatments or seed lots, run multiple replicates and use ANOVA or similar.
Limits of the calculator
- Single test only. The calculator handles one germination test at a time. For comparing multiple replicates, run the calculator on each separately and aggregate the results statistically (R, Excel, etc.).
- No viability prediction. The calculator reports GP and kinetics but does not predict viability from seed lot metadata (storage time, harvest conditions, etc.). For viability prediction, use the existing Seed Germination Calculator with storage longevity features.
- Standard germination conditions assumed. The interpretation bands assume standard paper towel or agar plate conditions at optimum temperature. Field emergence, sand bench tests, or petri dish assays under different conditions may produce different kinetics.
- Linear interpolation for T50. The calculator uses linear interpolation between bracketing time points. Probit- or model-based T50 estimates can be useful for some non-uniform series, but they require a separate statistical model. Use the linear interpolation T50 as a transparent default.
- Sigmoid fit assumes monotonic increase. The Gompertz and logistic fits assume a single sigmoid. Bimodal germination (two peaks, often from mixed seed lots or two dormancy fractions) is not captured by a single sigmoid and will give a poor fit with high RMSE.
- No dormancy-breaking calculations. The calculator handles already-germinated counts. Pre-treatments (cold stratification, scarification, GA3) are protocol-specific and outside the scope of this tool.
Related resources
For related calculations in botany and seed science, see these BioExplorer tools:
- Seed Germination Calculator: compute germination percentage, Wilson confidence interval, AOSA viability check, and storage longevity from a single count or full germination test.
- Specific Leaf Area Calculator: compute the standard leaf trait metrics used in plant ecology, with 20 species presets.
- Farquhar Photosynthesis Simulator: run the FvCB three-limitation model of C3 leaf photosynthesis for any leaf temperature and light level.
- Botany Calculators and Tools: the full collection of botany calculators on BioExplorer.
Frequently Asked Questions
Germination percentage (GP) is the total fraction of seeds that germinate by the end of the test, expressed as a percentage. T50 is the time at which 50 percent of the total seeds tested have germinated. A seed lot can have a high GP with a long T50 (slow but eventually complete germination) or a low GP with a short T50 (fast but partial germination). Both metrics together describe the size and speed of the observed germination response.
MGT (mean germination time) and T50 (median germination time) capture different aspects of the germination distribution. T50 is the time at which 50 percent of the total seeds tested have germinated; it is a single point on the cumulative curve. MGT is the time-weighted average of all germination events; it is sensitive to late-germinating outliers and to the shape of the distribution. For uniform germination, MGT and T50 are often close. For skewed distributions with a long tail of late germinators, MGT can be higher than T50. Reporting both gives a complete picture of the germination kinetics.
Many research protocols count germination when the radicle emerges through the seed coat, while official seed tests usually evaluate normal seedling development under species-specific rules. Abnormal seedlings are not counted as normal germination in official testing. If your protocol uses a different criterion (for example, radicle length 5 mm), apply it consistently and note it in your data. The calculator does not distinguish between normal and abnormal germination; it just sums the counts you enter.
Tetrazolium (TZ) tests stain living tissue red and are used as a viability assay for dormant or non-germinating seeds. The output is a count of red-stained (viable) seeds, not a germination time series. The calculator can process the final count (germination percentage = stained/total), but the MGT, T50, Timson, and sigmoid fits do not apply because there is no time dimension in a TZ test. Use the Seed Germination Calculator for single-count viability instead.
Yes. The typical MGT and T50 values in the presets are anchored to published seed biology literature, including the AOSA Rules for Testing Seeds, ISTA International Rules for Seed Testing, and primary papers on each species. The presets assume germination at the species optimum temperature under standard paper towel or agar plate conditions. Actual MGT in your lab will vary with media, incubator conditions, seed lot age, and operator technique. Use the presets as a sanity check, not as an expected value.
Both summarize germination kinetics but emphasize different aspects. MGT (mean germination time) is the time-weighted average of germination events; lower MGT means faster average germination. The Timson index is the sum of cumulative germination proportions across observation times; higher Timson values mean faster and more complete germination over the recorded window. For a perfectly uniform test in which all seeds germinate at the first observation, MGT equals that observation time and Timson approaches the number of observation times. For a typical sigmoid-shaped cumulative curve, Timson reflects both how early and how completely germination occurs. The two metrics are complementary: MGT for speed, Timson for speed and uniformity.
The BioExplorer Germination Rate Calculator is a free educational tool for seed test kinetics. It accepts both daily and cumulative count inputs, supports days or hours as the time unit, and returns germination percentage with Wilson 95 percent confidence interval, mean germination time (MGT), T50 (median germination time), Timson index, coefficient of velocity (CV), and mean daily germination. Twelve species presets supply reference MGT, T50, and optimum germination temperature ranges for comparison with experimental data. The calculator fits both a Gompertz and a logistic sigmoid to the cumulative curve using analytical linearization, and reports the lower-RMSE fit as the primary curve.
For single-count viability (no time series), use the existing Seed Germination Calculator. For leaf trait measurement, use the Specific Leaf Area Calculator. For photosynthesis modeling, use the Farquhar Photosynthesis Simulator. All math runs in the browser; no data is sent to a server.
References: Association of Official Seed Analysts; International Seed Testing Association; Ranal and Santana 2006 germination measurement review; Timson 1965 germination data method.