
Plant Trait Trade-Off Calculator
A plant trait trade-off calculator classifies leaf economics strategy from three measured traits: specific leaf area, leaf dry matter content, and (optionally) leaf nitrogen.
The same tool returns a 0 to 100 Leaf Economics Spectrum score, a leaf mass per area, a nitrogen per area, an empirical leaf lifespan estimate, and a cluster classification into one of six trait profiles. The math follows the global leaf economics spectrum literature and the TRY plant trait database.
Plant Trait Trade-Off Calculator
Classify leaf economics strategy from specific leaf area, leaf dry matter content, and (optionally) leaf nitrogen. Outputs leaf mass per area, nitrogen per area, empirical leaf lifespan, a 0–100 Leaf Economics Spectrum score, and a trait-cluster classification.
Input traits
Enter measured values from your leaf trait dataset, or pick a species preset for context.
Output
Press Calculate to compute the LES score, leaf mass per area, and trait cluster.
Leaf Economics Spectrum
Acq.
Cons.
Sub-scores
Trait cluster
Reference range comparison
Compared to TRY database central tendencies for the matched cluster.
Trait cluster reference
The calculator uses a priority-ordered decision tree. The first row whose trait range matches is reported as the cluster. Real species vary more than the cluster ranges suggest.
| Cluster | SLA range (m2/kg) | LDMC range (mg/g) | Typical examples |
|---|
Quick takeaways:
- The leaf economics spectrum captures one global trade-off in plant resource strategy, ranging from fast, cheap leaves (acquisitive) to slow, durable leaves (conservative).
- Three leaf traits, specific leaf area, leaf dry matter content, and leaf nitrogen, classify most vascular plants along this axis.
- This calculator turns your trait measurements into a 0 to 100 LES score, a leaf mass per area, a nitrogen per area, an empirical leaf lifespan, and a trait cluster.
What is the plant trait trade-off?
Plant ecologists have known for decades that leaf traits co-vary in a predictable way. A leaf that is thin and light (high specific leaf area) tends to have a high nitrogen content, photosynthesize fast, and live for a short time. A leaf that is thick and dense (high leaf mass per area) tends to be nutrient poor, photosynthesize slowly, and persist for many years. This single axis of variation, the leaf economics spectrum (LES), was first quantified globally by Wright and colleagues in 2004, drawing on data from over 2,500 species at 175 sites.
The trade-off is conceptually simple: plants have a fixed carbon budget, and they can invest it in either fast returns (cheap leaves that pay back quickly) or long-term durability (expensive leaves that last for years). Most species sit somewhere on this continuum, with grass crops, herbaceous forbs, and shade-tolerant understory plants at the fast end and pine, eucalyptus, and other sclerophylls at the slow end.
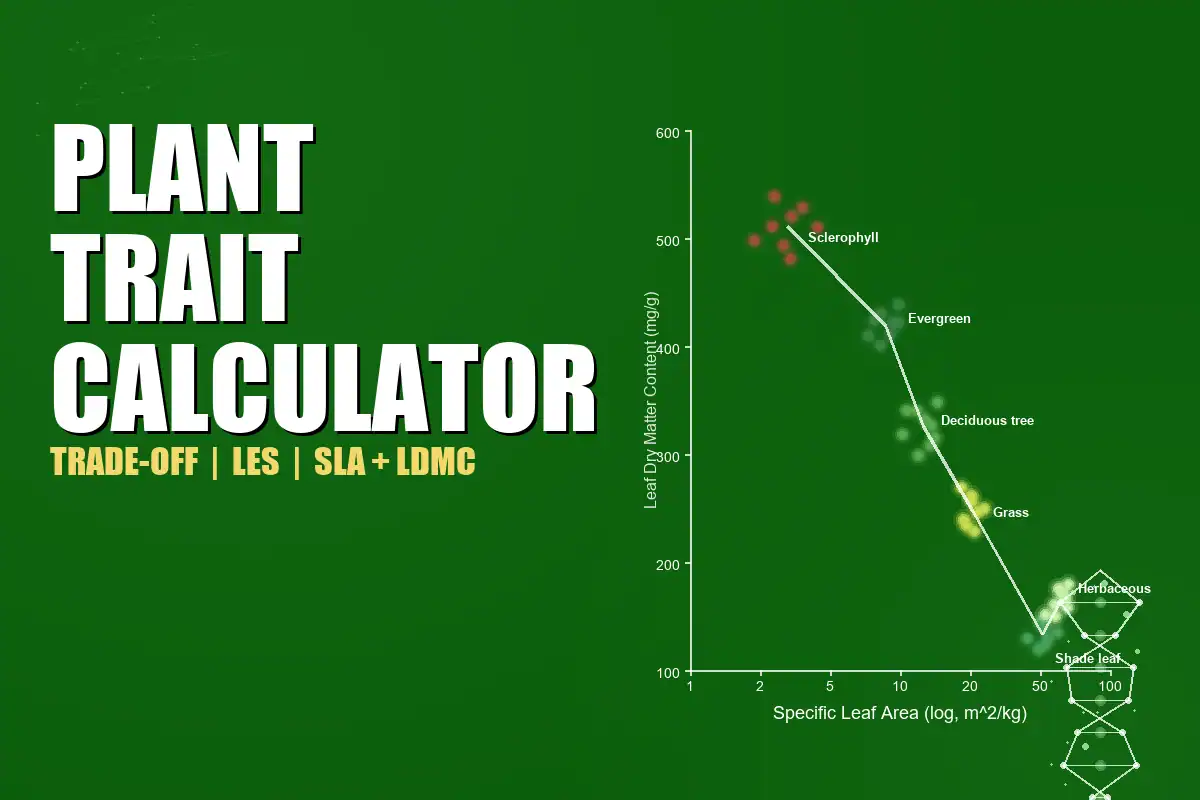
This calculator gives you a numerical score on the LES, plus a cluster classification (sclerophyll, shade leaf, herbaceous forb, deciduous tree, grass or crop, evergreen broadleaf) based on the trait ranges published in Pérez-Harguindeguy and colleagues’ widely used trait measurement handbook (2013) and the TRY plant trait database.
How to use the calculator
- Enter your trait values: You need specific leaf area (SLA, in m2/kg) and leaf dry matter content (LDMC, in mg/g) at minimum. Leaf nitrogen (Nmass, in mg/g) is optional but recommended for the most accurate LES score.
- Pick a species preset (optional): The dropdown shows central trait values for 12 common species. Selecting a preset shows the reference values but does not change your inputs. This is useful for comparing your measurements against published values.
- Press Calculate: The calculator runs the formulas and shows leaf mass per area, nitrogen per area, an empirical leaf lifespan estimate, the 0 to 100 LES score, the strategy label, the matched cluster, and a comparison against TRY database reference ranges.
- Read the result: A score below 25 means very acquisitive, between 25 and 45 means acquisitive, 45 to 60 is intermediate, 60 to 80 is conservative, and above 80 is very conservative. The cluster label tells you which functional group the trait profile matches.
The 6 trait clusters
The decision tree uses six clusters. Each cluster is defined by a specific combination of SLA and LDMC ranges. The priority order matters: the first matching cluster wins. The ranges are deliberately non-overlapping where possible; where they do overlap, the more diagnostic trait (usually SLA) takes priority.
| Cluster | SLA (m2/kg) | LDMC (mg/g) | Typical examples |
|---|---|---|---|
| Sclerophyll | 0 to 8 | 350 to 1000 | Pine, eucalyptus, holly, live oak |
| Shade leaf (very acquisitive) | 30 or more | less than 250 | Forest understory leaves, deep shade herbs |
| Herbaceous forb | 20 or more | less than 300 | Arabidopsis, sunflower, plantain, legumes |
| Deciduous tree | 8 to 20 | 250 to 500 | Maple, beech, oak (deciduous), poplar, birch |
| Grass or crop | 12 to 30 | 200 to 400 | Wheat, maize, ryegrass, fescue, rice |
| Evergreen broadleaf | 5 to 15 | 350 to 1000 | Citrus, camellia, live oak, holly |
The cluster labels describe the trait profile, not the species. An evergreen species with low SLA and high LDMC will be classified as sclerophyll, while a deciduous species with high SLA and low LDMC will be classified as herbaceous forb. This is intentional: the cluster tells you about resource strategy, not leaf habit.
Trait definitions and units
Specific leaf area (SLA)
SLA is the projected fresh leaf area per unit leaf dry mass. The units are m2/kg. A high SLA means a thin, light leaf (large area per gram of dry mass). A low SLA means a thick, dense leaf (small area per gram). The conversion is reciprocal: SLA = 1 / LMA. SLA and LMA carry the same information; many researchers report one or the other, and the calculator handles both.
Leaf mass per area (LMA)
LMA is the dry mass per unit projected leaf area, in g/m2. It is the inverse of SLA: LMA = 1000 / SLA. The factor of 1000 converts kg to g, since SLA is reported per kg. For example, a leaf with SLA = 10 m2/kg has LMA = 100 g/m2.
Leaf dry matter content (LDMC)
LDMC is the ratio of leaf dry mass to fresh mass, expressed in mg/g (which is the same as g/kg and also equivalent to per cent when divided by 10). A high LDMC means a dense, fibrous leaf with little water. A low LDMC means a watery, succulent, or thin leaf. LDMC is one of the easiest traits to measure in the field: weigh a fresh leaf, oven-dry it, weigh again, divide.
Leaf nitrogen content (Nmass)
Leaf nitrogen is reported as mass of nitrogen per unit leaf dry mass, in mg/g. Typical vascular plants range from 5 mg/g (sclerophylls) to 40 mg/g (fast-growing crops). Nmass is optional in the calculator; without it, the LES score uses only SLA and LDMC, with weights of 60 percent and 40 percent respectively. With Nmass, the weights become 50 percent SLA, 30 percent LDMC, and 20 percent Nmass.
Nitrogen per area (Narea)
Narea is the nitrogen content expressed per unit leaf area, in g/m2. It is calculated as Nmass × LMA / 1000. This matters because what a leaf actually invests in photosynthetic enzymes is nitrogen per area, not nitrogen per mass. For a given Nmass, a higher-LMA leaf will have a higher Narea because the same nitrogen content is spread over a leaf with more mass per unit area. A leaf with low Nmass (mostly structural carbon) will have low Narea even if LMA is high. The calculator shows Narea whenever Nmass is provided.
How the LES score is calculated
The Leaf Economics Spectrum score is a weighted composite of three sub-scores, each ranging from 0 to 100. A score of 0 means very acquisitive (cheap, fast leaves); a score of 100 means very conservative (expensive, durable leaves). The 0 to 100 score is an educational index based on published trait relationships; it is not an official Wright 2004 score or a TRY database output. The intent is to give researchers and students a quick way to position a leaf on the global spectrum without re-implementing the math.
Each sub-score is computed by mapping the trait value onto a 0 to 100 range with biologically meaningful anchors. SLA is inverted and uses a log scale, because trait distributions are right-skewed and log-normal (Wright et al. 2004), and because low SLA corresponds to the conservative end of the spectrum:
This anchors the score so that SLA = 3 m2/kg gives a sub-score of 100 (very conservative, sclerophyll-like) and SLA = 40 m2/kg gives a sub-score of 0 (very acquisitive, shade-leaf-like). Most vascular plants fall in this range, so the score resolves well across the typical spectrum.
LDMC uses a linear scale:
Anchored at 100 mg/g (very acquisitive) and 500 mg/g (very conservative).
Nmass is inverted, because high nitrogen is associated with the acquisitive end:
The final LES score is the weighted sum of sub-scores. When all three traits are provided, the weights are SLA 50 percent, LDMC 30 percent, Nmass 20 percent. When Nmass is missing, the weights are SLA 60 percent, LDMC 40 percent.
Strategy labels map onto the score: less than 25 is very acquisitive, 25 to 45 acquisitive, 45 to 60 intermediate, 60 to 80 conservative, 80 to 100 very conservative.
Empirical leaf lifespan approximation
The calculator estimates leaf lifespan in months from SLA using an empirical relationship from the global meta-analysis by Reich and colleagues (1999):
For example, an oak leaf with SLA = 10 has an estimated lifespan of about 8 months, which is close to the observed 5 to 7 month lifespan of temperate deciduous oak leaves. Pine needles with SLA = 5 have an estimated lifespan of 16 months; real pine needles typically live 24 to 48 months, so the calculator slightly under-predicts at the sclerophyll end.
This approximation has known limitations. The published SLA to lifespan regressions have R-squared values of only 0.3 to 0.5, meaning the trait explains about a third to half of the variation in lifespan. Real lifespan is also strongly affected by climate, herbivory, and disturbance. The calculator flags extreme estimates (above 20 years or below 2 weeks) with a biological note.
Reference ranges and the TRY database
The reference range comparison is informed by the TRY plant trait database, which compiles published trait measurements from over 1,000 studies worldwide, and by broad trait ranges reported in plant functional trait handbooks and global LES studies. The reference ranges used here represent teaching-scale central tendencies for each trait cluster, with deliberately wide bounds to account for site-to-site variation. The calculator shows whether your measured values fall within, below, or above the reference range for the matched cluster.
When your value is above or below the reference range, that is a signal worth investigating. It might mean you have a unique species, an unusual population, a measurement error, or a site with extreme conditions (high light, low nutrients, drought, etc.). The reference comparison is a sanity check, not a quality judgment.
When to use this calculator
This tool is designed for functional trait research, vegetation surveys, and teaching. Five common use cases are below.
- Graduate plant ecology labs: When you measure SLA, LDMC, and Nmass for a set of species and want to position each species on the leaf economics spectrum without computing the score by hand.
- Undergraduate ecology courses: When teaching functional trait ecology and showing students how three simple measurements translate to a global axis of plant variation. The preset species list covers the common teaching examples (oak, pine, wheat, Arabidopsis).
- Restoration projects: When selecting species for revegetation and you want to characterize candidate species by their resource strategy, for example, picking acquisitive species for fast cover or conservative species for long-term stability.
- Crop breeding: When comparing cultivar trait profiles to the wild-type or to a model grass like wheat, and asking whether a new variety sits on the conservative or acquisitive end.
- Functional group analysis: When grouping species in a vegetation dataset by trait cluster, for ordination, classification, or community-weighted mean calculations.
How this fits with the other botany calculators
- The Plant Trait Trade-Off Calculator sits alongside the other botany tools. For a single leaf, the Specific Leaf Area Calculator gives a quick LMA conversion.
- For whole-plant allocation, the Root:Shoot Ratio Calculator covers the belowground versus aboveground trade-off.
- For seed germination timing, the Germination Rate Calculator handles the time-to-emergence axis.
All four tools share the same trait-based, decision-tree design philosophy. The full set lives at the botany calculators hub.
Sources and further reading
The trait ranges, the LES score formula, the leaf lifespan approximation, and the reference ranges used in this calculator are drawn from the following peer-reviewed sources.
- Wright IJ, Reich PB, Westoby M, et al. (2004). The worldwide leaf economics spectrum. Nature 428: 821 to 827. doi:10.1038/nature02403
- Reich PB (2014). The worldwide fast to slow plant economics spectrum. Journal of Ecology 102: 275 to 301. doi:10.1111/1365-2745.12211
- Reich PB, Ellsworth DS, Walters MB, et al. (1999). Generality of leaf trait relationships: a test across six biomes. Ecology 80: 1955 to 1969. doi:10.1890/0012-9658(1999)080[1955:GOLTRA]2.0.CO;2
- Pérez-Harguindeguy N, Díaz S, Garnier E, et al. (2013). New handbook for standardized measurement of plant functional traits worldwide. Australian Journal of Botany 61: 167 to 234. doi:10.1071/BT12225
- Pierce S, Negreiros D, Cerabolini BEL, et al. (2017). A global method for calculating plant CSR ecological strategies. Functional Ecology 31: 444 to 457. doi:10.1111/1365-2435.12755
- Kattge J, Díaz S, Lavorel S, et al. (2011). TRY: a global database of plant traits. Global Change Biology 17: 2905 to 2935. doi:10.1111/j.1365-2486.2011.02451.x
Frequently asked questions
SLA (specific leaf area) is the projected fresh leaf area per unit leaf dry mass, in m2/kg. LMA (leaf mass per area) is the dry mass per unit projected leaf area, in g/m2. They are reciprocals, related by LMA = 1000 / SLA. The factor of 1000 converts kg to g. Many researchers report one or the other; the calculator accepts SLA as the input and computes LMA for you.
Most vascular plants fall between 5 and 30 m2/kg. Sclerophylls (pine, holly, eucalyptus) are at the low end, around 3 to 8. Deciduous trees and most crops are in the middle, around 10 to 25. Herbaceous forbs and shade-tolerant species are at the high end, around 20 to 50. Values above 50 are unusual and typically indicate very thin, shade-adapted leaves.
The leaf lifespan estimate is approximate. It uses a global empirical relationship (Reich 1999) where leaf lifespan in months is approximately 80 / SLA. The published R-squared is 0.3 to 0.5, meaning SLA explains about a third to half of the variation in real lifespan. Climate, herbivory, and disturbance also matter. The calculator flags extreme estimates (above 20 years or below 2 weeks) with a biological note. For research-grade lifespan prediction, measure the lifespan directly by tagging leaves and tracking cohorts.
SLA and LDMC capture different things. SLA reflects how much area a leaf builds per unit dry mass, which combines leaf thickness and density. LDMC reflects how much of the fresh leaf is dry mass, which is a measure of tissue density and water content. A leaf can be thin (high SLA) but dense (high LDMC), or thick (low SLA) but watery (low LDMC). The combination of the two separates these cases, which is why both traits are needed to classify into the six clusters.
The LES score is a 0 to 100 weighted composite of the three sub-scores. A score of 0 means the leaf is at the extreme acquisitive end of the global spectrum (cheap, fast, short-lived, high nitrogen). A score of 100 means the extreme conservative end (expensive, slow, long-lived, low nitrogen). The strategy label bands are very acquisitive (less than 25), acquisitive (25 to 45), intermediate (45 to 60), conservative (60 to 80), and very conservative (80 to 100). The score is most useful for comparing species or populations to each other; absolute values matter less than the relative position.
Yes. The grass or crop cluster covers C3 and C4 grasses including wheat, maize, rice, ryegrass, and fescue. Broadleaf crops such as soybean fall into the herbaceous forb cluster; legumes, oilseeds, and similar dicot crops can be entered directly. The presets include 12 common species across 6 categories. If your crop is not in the preset list, enter the measured SLA, LDMC, and Nmass directly.
The decision tree covers most common vascular plant profiles, but unusual values are reported as an unclassified trait profile. This is intentional: an extreme value should not be forced into a grass, crop, tree, or sclerophyll label if the SLA and LDMC combination does not match those ranges. In that case, use the raw trait values, the LES score, and the reference range comparison rather than treating the cluster label as a species classification. The reference comparison will still flag values that are above or below the typical range, which is often the more useful signal.
The reference ranges are drawn from the TRY plant trait database (Kattge et al. 2011), which compiles published measurements from over 1,000 studies worldwide. The ranges used here represent the central tendency for each trait cluster, with bounds set wide enough to capture site-to-site and population-level variation. They are intended as a sanity check for your measurements, not a strict pass or fail criterion.
This educational tool was developed by BioExplorer for plant ecologists, agronomists, restoration practitioners, and students working with leaf functional traits. It uses a deterministic educational index built from specific leaf area, leaf dry matter content, and leaf nitrogen, with anchor points chosen from the global LES literature.
The calculator is open and free to use. Source code and test suite are available in the published package. If you need a more flexible or research-grade multivariate strategy tool, consider the R package StrateFy (Pierce et al. 2017) or a custom script in R or Python.
Cite this page
BioExplorer. (2026, August 26). Plant Trait Trade-Off Calculator. https://www.bioexplorer.net/plant-trait-trade-off-calculator/