
Farquhar Photosynthesis Simulator
A Farquhar photosynthesis simulator runs an educational implementation of the FvCB biochemical model of C3 photosynthesis with temperature-sensitive parameters for quick sensitivity analysis.
The same tool computes the three net limiting rates (Ac, Aj, Ap), plots the A vs Ci curve, identifies the limiting regime, and estimates net assimilation across leaf temperature, intercellular CO2, and photosynthetic photon flux density (PPFD).
Farquhar Photosynthesis Simulator
The FvCB biochemical model of C3 photosynthesis with Bernacchi 2001/2002 temperature response. Pick a plant preset or enter your own parameters to see Ac, Aj, Ap rates and the A vs Ci curve at any temperature.
How to use this simulator
- Pick a plant preset (Generic C3, Tobacco, Tomato) or enter your own values for Vcmax, Jmax, TPU, and Rd.
- Set leaf temperature, photosynthetic photon flux density (PPFD), and the intercellular CO2 (Ci) to evaluate.
- Watch the three limit rates (Ac, Aj, Ap) update and the A vs Ci curve redraw. The chart marker shows the chosen Ci.
- The limiting regime pill tells you which process sets the net photosynthesis rate at the chosen Ci.
Inputs
Parameters at this temperature
These values come from the temperature response model (Bernacchi 2001 in vivo for Kc, Ko, and GammaStar; Bernacchi 2002 with deactivation for Vcmax, Jmax, TPU; Kumarathunge 2019 for Rd). The generic C3 preset at 25 °C uses Vcmax = 80, Jmax = 120, TPU = 12, and Rd = 1.5.
Net assimilation at the chosen Ci
How to use the Farquhar Photosynthesis Simulator
- Pick a plant preset from the dropdown. Three presets ship with this version: Generic C3, Tobacco, and Tomato.
- Adjust the Vcmax, Jmax, TPU, and Rd fields if your species or experiment differs from the preset.
- Set the leaf temperature in degrees Celsius. The simulator updates the temperature-sensitive parameters automatically.
- Set the photosynthetic photon flux density (PPFD) in micromoles of photons per square meter per second. Typical lab light runs 500 to 1500.
- Set the intercellular CO2 concentration Ci in microbars (1 Pa equals 10 µbar). Ci is intercellular CO2, so it is often lower than external atmospheric CO2(Ca). Use measured or estimated Ci when available.
- Watch the three limit rates (Ac, Aj, Ap), the net A, and the limiting regime pill update live. The chart redraws on every change.
What the Farquhar model is
The Farquhar model is the standard biochemical model of leaf photosynthesis for C3 plants. The original paper, “A biochemical model of photosynthetic CO2 assimilation in leaves of C3 species” by Graham Farquhar, Susanne von Caemmerer, and Joseph Berry (Planta 149, 78-90, 1980), unified earlier observations under a single framework: leaf carbon uptake is constrained by the slowest active biochemical process.
The original 1980 model distinguished two limiting processes: Rubisco-limited carboxylation (Ac) and RuBP-regeneration-limited assimilation (Aj). Triose phosphate utilization (Ap) is commonly included as a third possible limit at high CO2. The expanded framework is widely used in leaf gas exchange analysis and is often called the FvCB model after the three original authors.
Who Graham Farquhar is

Graham Farquhar is an Australian plant physiologist and Distinguished Professor at the Australian National University. He is best known for developing process-based models of photosynthesis that help explain how plants exchange carbon dioxide with the atmosphere under changing light, temperature, water, and CO2 conditions. The Inamori Foundation awarded him the 2017 Kyoto Prize in Basic Sciences for this work and its contributions to environmental and climate-change science.
In this simulator, Ac, Aj, and Ap are already net rates after subtracting day respiration Rd, so the realized net assimilation rate A is the minimum of those three net rates. The shape of A as a function of Ci is the A vs Ci curve, a standard diagnostic for photosynthetic capacity.
How the FvCB model works
The model divides leaf photosynthesis into three biochemical limits. Each limit represents a different process that can become the bottleneck under given conditions.
Rubisco-limited rate (Ac)
The carboxylation rate is limited by the activity of the enzyme Ribulose-1,5-bisphosphate carboxylase/oxygenase (commonly called Rubisco). The equation comes from Michaelis-Menten kinetics:
Ac = Vcmax × (Ci - Γ*) / (Ci + Kc × (1 + O / Ko)) - Rd
Where Vcmax is the maximum carboxylation rate at the current leaf temperature, Γ* is the CO2 compensation point (the Ci at which gross photosynthetic uptake equals photorespiratory release), Kc is the Michaelis constant for carboxylation, Ko is the Michaelis constant for oxygenation, O is the oxygen partial pressure, and Rd is day respiration. The term (1 + O/Ko) accounts for the competitive inhibition of carboxylation by oxygen, which is the chemical basis of photorespiration.
RuBP-regeneration-limited rate (Aj)
When Rubisco has enough substrate, the next limit is the rate at which the leaf regenerates the five-carbon acceptor molecule ribulose 1,5-bisphosphate (RuBP). This regeneration runs through photosynthetic electron transport, with the rate set by J:
Aj = J × (Ci - Γ*) / (4 × Ci + 8 × Γ*) - Rd
J itself depends on the photosynthetic photon flux density (PPFD) through the non-rectangular hyperbola:
J = (α × I + Jmax - sqrt((α × I + Jmax)^2 - 4 × θJ × α × I × Jmax)) / (2 × θJ)
Where α is the apparent quantum yield used by this simulator, I is PPFD, Jmax is the maximum electron transport rate at current temperature, and θJ is the curvature parameter. The equation captures the curved light response of electron transport and approaches Jmax at high light.
TPU-limited rate (Ap)
At very high Ci, the Calvin-Benson cycle can outpace the rate at which triose phosphates are exported and used for sucrose or starch synthesis. This third limitation is represented here with the simplified TPU expression:
Ap = 3 × TPU - Rd
Where TPU is the maximum rate of triose phosphate utilization. TPU rarely limits photosynthesis under standard measurement conditions but appears under high light and elevated CO2 in some species.
Net assimilation and limiting regime
Because each limiting rate already includes Rd, realized net assimilation is:
A = min(Ac, Aj, Ap)
The smallest of the three rates identifies the limiting regime. In the simulator’s default setup at Ci = 400 µbar and PPFD = 1000, Aj is the minimum rate, so the result is RuBP-regeneration-limited. In real leaves, the limiting regime depends on Ci, light, temperature, Vcmax, Jmax, and acclimation. Below the CO2 compensation point, net assimilation is negative.
Temperature response in the simulator
Photosynthesis depends strongly on leaf temperature. Some biochemical constants in this simulator follow in vivo tobacco functions from the Bernacchi et al. 2001 parameter set, while the main capacity parameters use simplified educational temperature responses:
- Vcmax, Jmax, TPU, and Rd use an Arrhenius activation term plus high-temperature deactivation in this simulator. The exact optimum depends on the parameter and the selected baseline value.
- The Michaelis constants Kc and Ko and the CO2 compensation point Γ* follow plain Arrhenius curves without deactivation. They rise monotonically with temperature.
- Kc, Ko, and Γ* follow the Bernacchi et al. 2001 in vivo tobacco functions used in many C3 photosynthesis analyses.
- Vcmax, Jmax, TPU, and Rd use Arrhenius activation plus high-temperature deactivation so the calculator can show both warming-driven increases and heat-related declines.
At high leaf temperatures, the deactivation term reduces simulated parameter values. This mimics the decline in photosynthetic capacity often observed above a leaf’s physiological optimum, but it should not be interpreted as a species-specific heat-damage prediction.
Worked examples
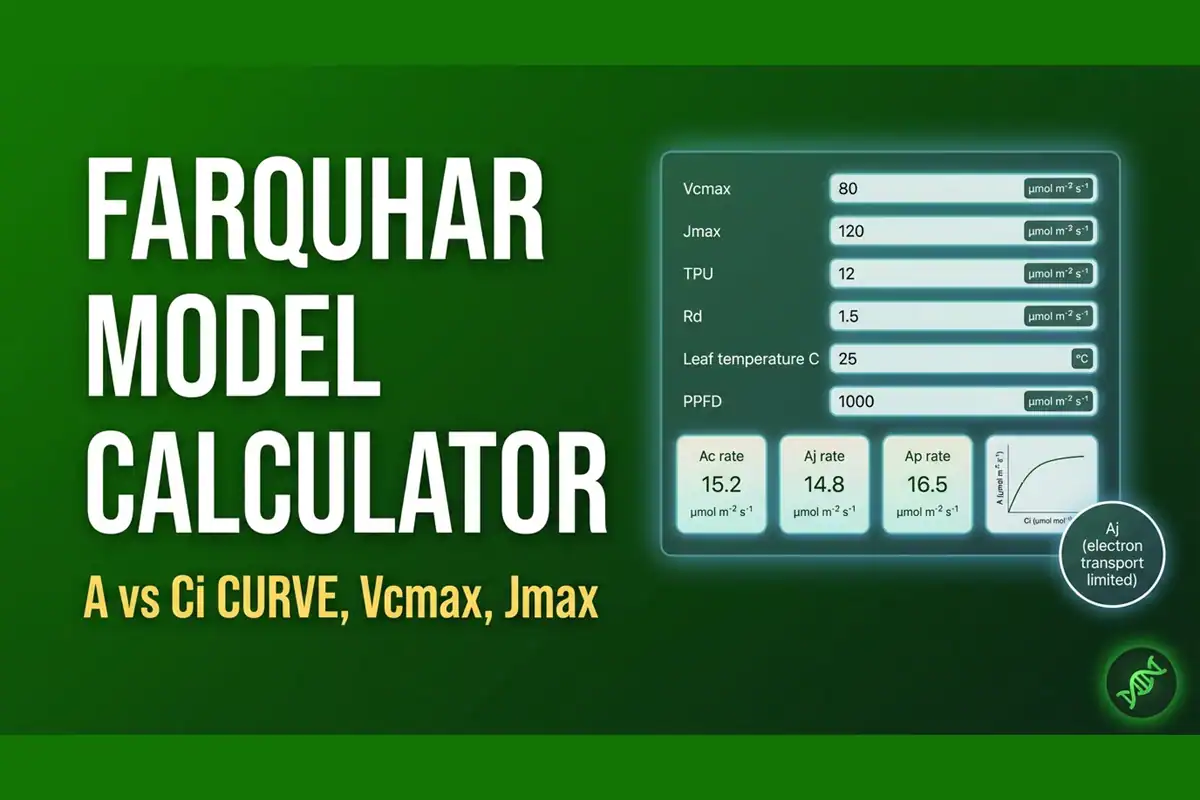
Example 1: Generic C3 plant at ambient conditions (the A vs Ci curve)
Setup: Use the Generic C3 preset with default values (Vcmax = 80, Jmax = 120, TPU = 12, Rd = 1.5). Set leaf temperature to 25 degrees Celsius, PPFD to 1000 micromoles of photons per square meter per second, and Ci to 400 microbars.
Inputs: species Generic C3, T = 25 °C, PPFD = 1000, Ci = 400.
Results: Ac = 28.7 micromoles per square meter per second, Aj = 8.0, Ap = 34.5. The realized net A = 8.0 micromoles per square meter per second. Limiting regime: RuBP-regeneration-limited.
Discussion: In this default simulator setup, electron transport is the bottleneck at Ci = 400 µbar and PPFD = 1000. Raising Vcmax would not help unless another setting changed the limiting regime. Raising PPFD would help, but the gain is small since J is already at 49.5 µmol m⁻² s⁻¹ out of a Jmax of 120. A larger PPFD above 1500 pushes J closer to Jmax and raises A further.
Example 2: Temperature response in the default simulator setup
Setup: Keep the Generic C3 preset parameters. Sweep leaf temperature from 5 degrees Celsius to 45 degrees Celsius in 5 degree steps at PPFD = 1000 and Ci = 400.
Inputs: Generic C3 preset, T = 5 to 45 °C sweep, PPFD = 1000, Ci = 400.
Results: In this simulator setup, Vcmax rises from about 12 µmol m⁻² s⁻¹ at 5°C to about 166 at 40°C, while Jmax rises to a peak near 35°C and then declines. Net assimilation A is about 5.9 at 5°C, about 8.2 at 20°C, about 8.0 at 25°C, about 7.3 at 30°C, and about 4.5 at 45°C.
Discussion: The default curve shows why temperature responses must be interpreted at the whole-model level. Individual parameters can peak at different temperatures, and the realized A is controlled by the lowest net limiting rate plus the temperature response of Rd. Real species can differ substantially from these default settings.
Example 3: Light response at low Ci (Rubisco-limited)
Setup: Set Vcmax = 80, Jmax = 400, TPU = 12, Rd = 1.5. Set T = 25°C, PPFD = 3000, and Ci = 50 µbar.
Inputs: Vcmax = 80, Jmax = 400, T = 25°C, PPFD = 3000, Ci = 50.
Results: Ac is about 0.20 µmol m⁻² s⁻¹, Aj is about 2.51, and Ap is about 34.5. The realized net A is about 0.20 µmol m⁻² s⁻¹. Limiting regime: Rubisco-limited.
Discussion: Raising Jmax and PPFD removes electron transport as the bottleneck, so the low-Ci behavior becomes Rubisco-limited. This example is intentionally artificial: it is designed to make the Ac limitation visible for teaching.
How this tool compares to research-grade software
This Farquhar photosynthesis simulator is for educational estimation and quick sensitivity analysis. One widely used research-grade tool is the plantecophys R package (Duursma 2015), which fits A vs Ci curves to experimental data and returns Vcmax and Jmax estimates. The photosynthesis R package (Buckley and Diaz-Espejo 2015) is another option with more flexible temperature response options.
For fitting measured curves, the Sharkey 2019 protocol (Plant, Cell and Environment 42, 369-384) provides a step-by-step workflow. Curve fitting is the standard approach for Vcmax and Jmax extraction from gas exchange data, and the simpler model here complements but does not replace those tools.
This Farquhar photosynthesis simulator pairs naturally with the Specific Leaf Area Calculator on BioExplorer. SLA measures the leaf area used to normalize photosynthesis rates, and the Farquhar model computes the rate per unit leaf area. Together they connect leaf structure with leaf-level gas exchange. The full biology tools directory on BioExplorer lists related calculators.
Limits and assumptions
This Farquhar photosynthesis simulator makes several simplifications for educational use. For research-grade work, more sophisticated approaches are available.
- The model covers C3 photosynthesis only. C4 plants use a different biochemical framework (von Caemmerer 2000) with bundle sheath CO2 concentrating mechanisms that this tool does not handle.
- Stomatal conductance is not modeled. The user provides Ci directly. Real plants have stomata that determine Ci from atmospheric CO2. The model does not couple photosynthesis to transpiration or stomatal aperture.
- TPU is treated with the simplified form 3 times TPU minus Rd. The more general Yin 2021 form includes serine export fraction, which is non-zero in some conditions but typically small for C3 leaves during active photosynthesis.
- The Bernacchi parameter set comes from tobacco in vivo measurements. Other species show different parameter values; the three presets in this tool are teaching presets and do not cover all cultivar variation.
- The 105 unit tests for this tool cover the documented test cases but do not exhaustively test all parameter combinations. Curve fitting with measured gas exchange data is the appropriate way to validate the model for a specific experiment.
- The Farquhar model assumes steady-state conditions. Dynamic transients (stomatal opening, lightflecks, gas exchange equilibration) are not handled.
Related Resources





Frequently Asked Questions
The Farquhar model is the standard biochemical model of C3 photosynthesis published by Graham Farquhar, Susanne von Caemmerer, and Joseph Berry in 1980. This simulator represents leaf carbon uptake with three possible net limiting rates: Rubisco carboxylation capacity (Ac), RuBP regeneration through electron transport (Aj), and triose phosphate utilization (Ap). The realized net assimilation A equals the minimum of those net rates. The same framework is often called the FvCB model after the three original authors.
Vcmax stands for the maximum rate of Rubisco carboxylation. It reflects the amount and activity of the enzyme Rubisco in the leaf, which fixes CO2 onto the five-carbon acceptor molecule ribulose 1,5-bisphosphate (RuBP). Typical Vcmax values for C3 plants at 25 degrees Celsius range from 60 to 120 micromoles per square meter per second. Higher Vcmax means the leaf can process more CO2 per unit time when Rubisco activity is the limiting factor.
An A vs Ci curve plots net photosynthesis A on the vertical axis against intercellular CO2 concentration Ci on the horizontal axis. At low Ci, the curve can be limited by Rubisco capacity (Ac) when electron transport is not the tighter constraint. At intermediate Ci, it often flattens as RuBP regeneration through electron transport (Aj) becomes limiting. At high Ci, the curve may become flat or decline if triose phosphate utilization (Ap) becomes limiting. The point where any two limit rates cross marks a transition between regimes.
In the simulator default at Ci around 400 µbar and PPFD = 1000, photosynthesis is limited by RuBP regeneration through electron transport (Aj). In real leaves, the limiting regime depends on the measured Ci, light, temperature, nitrogen status, Vcmax, Jmax, TPU, and acclimation history.
Both Vcmax and Jmax rise with temperature up to a thermal optimum, then decline. The simulator uses Arrhenius activation and high-temperature deactivation terms to show how photosynthetic parameters can rise with temperature and then decline. The exact optimum in the model depends on the parameter and the selected baseline values, so it should not be treated as a species-specific heat-tolerance prediction.
With the default values in this simulator, the Rubisco-to-RuBP-regeneration transition falls below the CO2 compensation point, so the visible physiological range is mostly Aj-limited. To see a Rubisco-limited phase clearly, raise Jmax and PPFD or lower Ci. The example section shows one artificial setup that makes the Rubisco-limited region visible.
This Farquhar photosynthesis simulator was built for plant physiology students, agronomists, and ecology researchers who want a quick way to explore the FvCB biochemical model of C3 photosynthesis without setting up an R environment.
The math follows the Farquhar, von Caemmerer, and Berry 1980 framework with temperature-adjusted parameter functions for educational sensitivity analysis. The model is not a replacement for fitting measured gas exchange data. Researchers should pair this tool with plantecophys, the photosynthesis R package, or the Sharkey 2019 fitting protocol for Vcmax and Jmax extraction.
References:
- Farquhar, von Caemmerer, and Berry 1980
- Bernacchi et al. 2001
- Kyoto Prize in Basic Sciences in 2017
- Sharkey 2019
- Duursma 2015 plantecophys.
Cite this page
BioExplorer. (2026, September 30). Farquhar Photosynthesis Simulator. https://www.bioexplorer.net/farquhar-photosynthesis-simulator/